🌍 Public
Analyzing Missing Migrants. Part II Aggregation by Month
OOleg Zhernovoy
Last edited Dec 9, 2022
Created on Dec 9, 2022
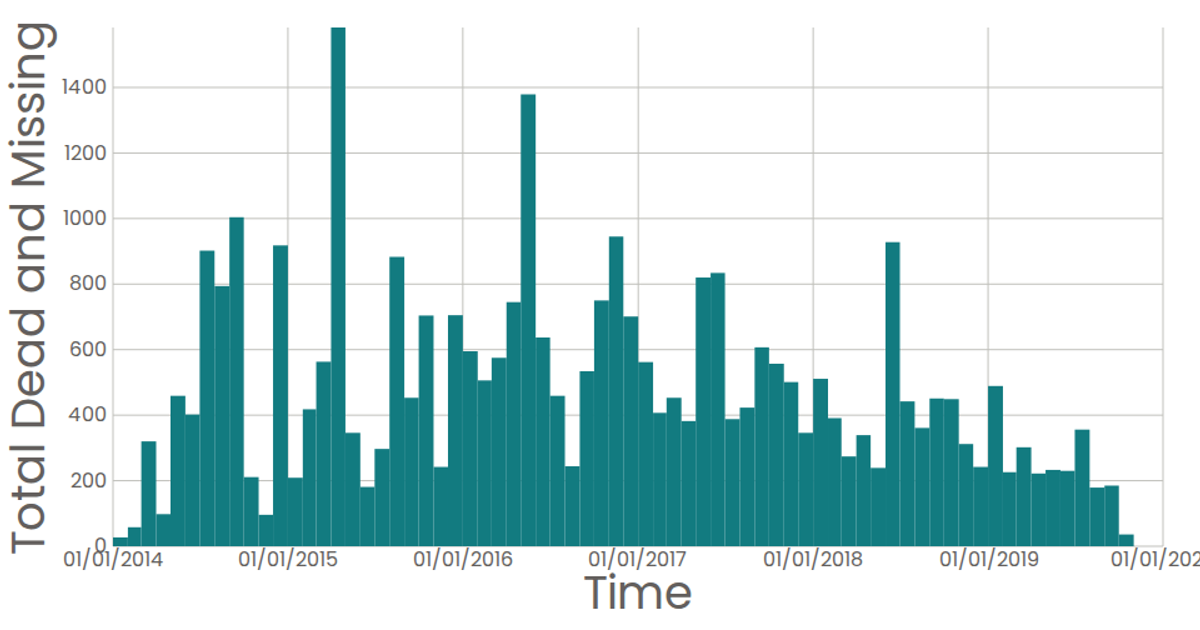
This visualization is a bar chart that aggregates monthly totals of dead and missing migrants from a subset of the Missing Migrants Project dataset, highlighting the number of deaths reported each month. The chart uses React with D3 v7 APIs, including `scaleTime`, `scaleLinear`, `bin`, `timeMonths`, and `sum`, to bin the data by month and render SVG rectangles as bars. Axes are drawn via custom components, with tooltips showing exact totals on hover, and the final chart displays the data from 2014 through 2019.
AI-generated descriptionA bar chart of Missing Migrants Statitics
MIT Licensed




Comments
Sign in to join the discussion.