
0 views in last 90 days
Oleg Zhernovoy
@olehna
Public vizzes

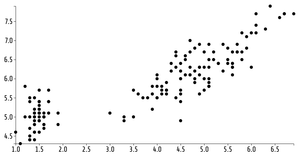
Scatter Plot World Heritage List
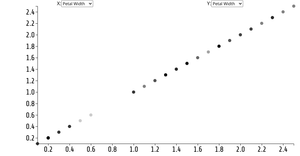
Scatter Plot with Menus Including Species
Animated Scatter Plot with Menus
Animated Reusable D3 Scatter Plot
D3 Scatter Plot
Reusable D3 Scatter Plot
Reusable D3 Scatter Plot with Symbols

D3 Selection Exploration

Sol LeWitt Reproduction with D3

Sol LeWitt Reproduction HTML + SVG

RP branches
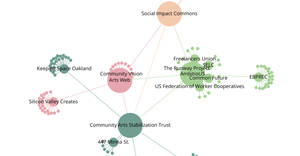
Organization Network Graph_5
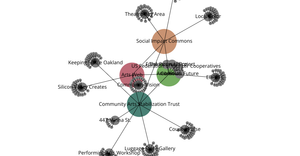
Organization Network Graph_4
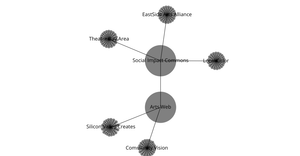
Organization Network Graph_3

Organization Network Graph_2
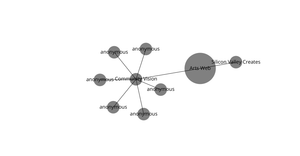
Organization Network Graph

Bowl of Fruits - General Update Pattern of D3.js_Nested Elements

Bowl of Fruits - General Update Pattern of D3.js
Line Chart With Voronoi Overlay With Labels

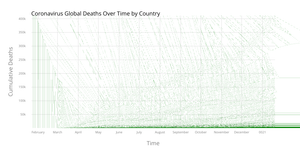
Line Chart with Multiple Lines by Country With Voronoi Overlay

Line Chart with Multiple Lines by Country
Line Chart with Labels
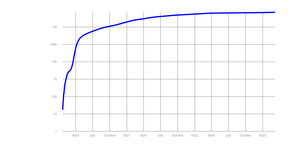
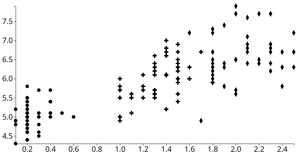
Line Chart Log Y Axis
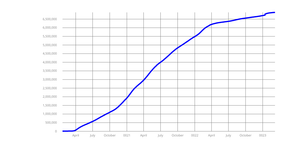
Line Chart Linear Y Axis
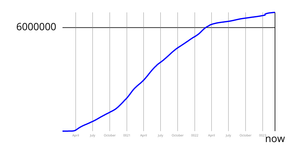
Line Chart With Marker Lines and D3 Axes
Coronavirus Line Chart With 5,000,000 Marker Line

Coronavirus Line Chart With 5,000,000 Marker Line

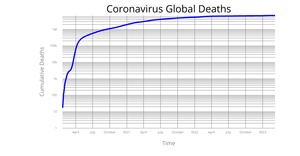
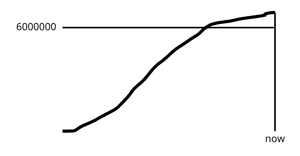
Basic Coronavirus Line Chart
Summarizing Coronavirus Data

Loading and Parsing Coronavirus Dataset

Coronavirus Basic Line Chart
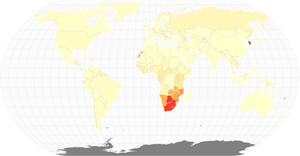
HIV/AIDS Choropleth Map
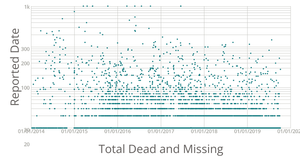
Analyzing Missing Migrants. Part I Loading & Visualization the Data (LogScale)
Analyzing Missing Migrants. Part VI Brushing

Analyzing Missing Migrants. Part V Multiple Views. Cleanup

Analyzing Missing Migrants. Part IV Multiple Views
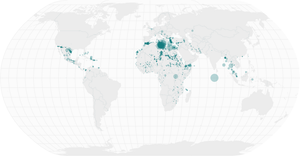
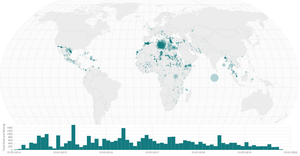
Analyzing Missing Migrants. Part III On a Map
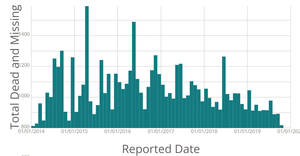
Analyzing Missing Migrants. Part II Aggregation by Month
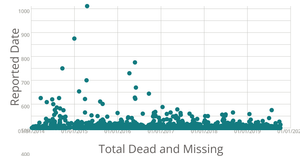
Analyzing Missing Migrants. Part I Loading & Visualization the Data
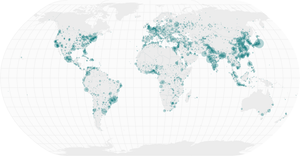
Points on a Map Using Size
Points on a Map

Polished Scatter Plot with Menus, Color and Interactive Color Legend

Polished Scatter Plot with Menus, Color and Legend

Polished Scatter Plot with Menus and Color

Polished Scatter Plot with Menus

Menus with React
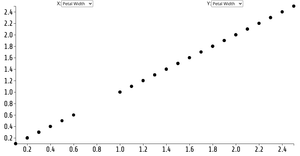
Scatter Plot with Menus

React Starter

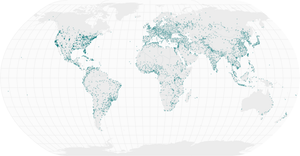
World Map
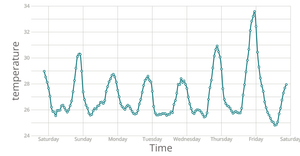
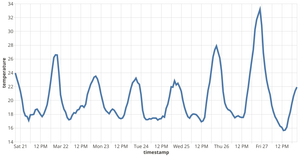
Temperature Line Chart
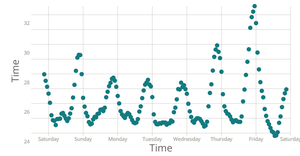
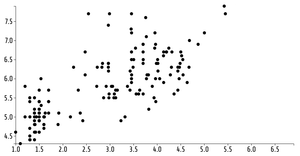
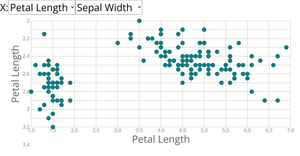
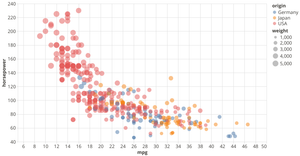
Temperature Scatter Plot
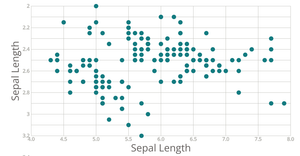
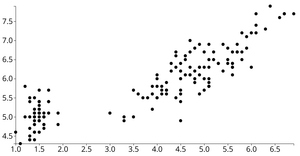
Scatter Plot

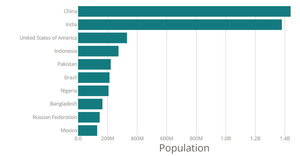
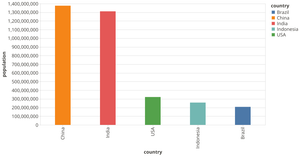
Bar Chart Countries Population
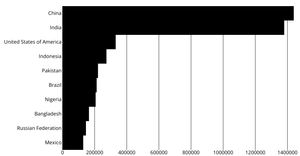
Stylized Bar Chart

Refactored Bar Chart
Axes with React And D3

The Margin Convention

Colors Pie Chart using React and D3

Loading Data with React & D3
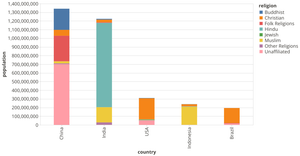
Vega-Lite API Template_Stacked Bars
Vega-Lite API Template_Bars
Vega-Lite API Template_Temperature
Vega-Lite API Template

Mouse Follower

Smiley Face
