🌍 Public
Task9Q1
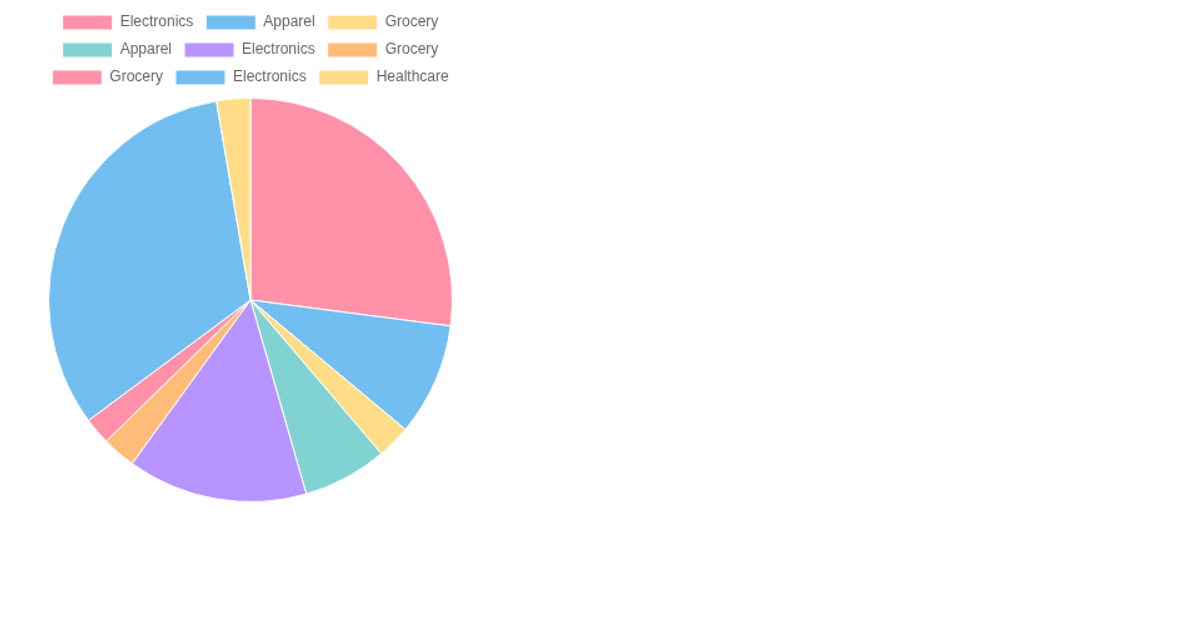
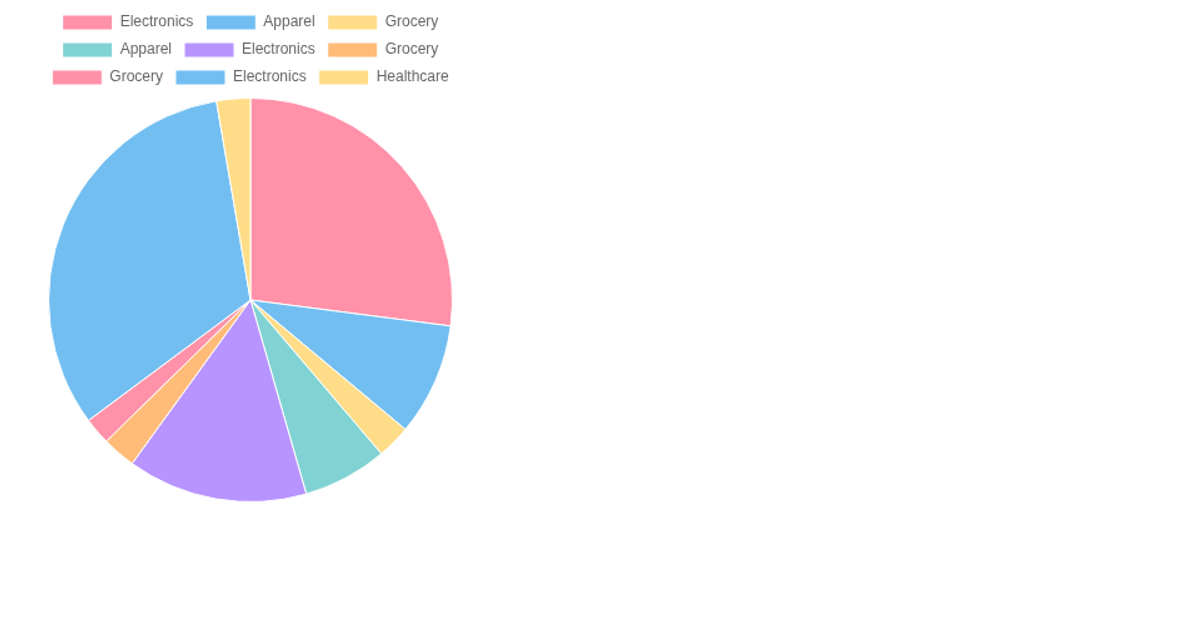
This pie chart displays the proportion of total sales for each item category in the Walmart sales dataset, loaded from a remote CSV file hosted on GitHub. The chart is rendered on an HTML `<canvas>` element using the Chart.js library, which is configured with a pie chart type, category labels from the third column, and sales totals from the seventh column of each data row. The visualization uses a fixed 450×450 pixel canvas with a set of semi-transparent background colors, and the chart is drawn with a non-responsive, non-aspect-ratio-preserving configuration.
AI-generated descriptionMIT Licensed





Comments
Sign in to join the discussion.