🌍 Public
Fork of Rendering Data with React & D3
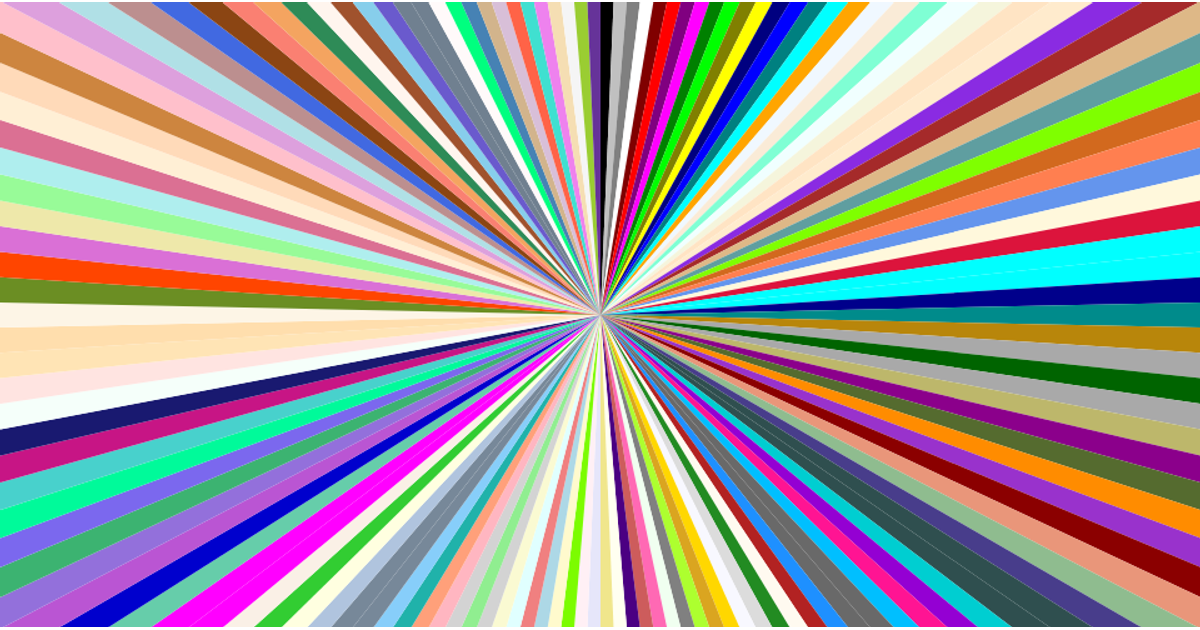
This example shows a radial burst visualization of CSS named colors, where each color from the dataset is rendered as a filled arc segment radiating from the center of an SVG canvas. The code loads CSV data using the `d3.csv` function and computes the arc paths with `d3.arc` and `d3.pie`, while React manages the component state and renders each `<path>` element. The dataset contains color names and their RGB hex values, which are used directly as the fill color for each segment. The visualization uses a fixed 960 by 500 pixel SVG and processes the data asynchronously with React’s `useEffect` hook.
AI-generated descriptionA program that loads in some data about CSS named colors using D3 utilities, and uses React to render the data as a radial burst!
MIT Licensed




Comments
Sign in to join the discussion.