🌍 Public
React and bar chart Right Approach
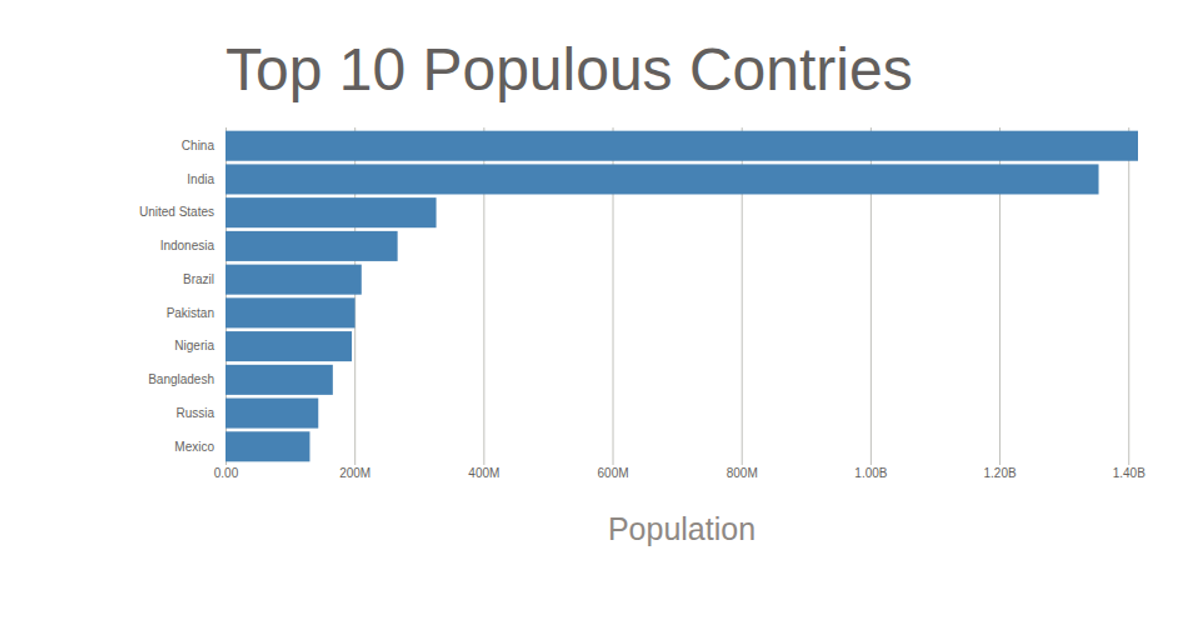
A horizontal bar chart ranks the ten most populous countries, with bar lengths proportional to population and country names on the vertical axis. Built with React and D3 v5, the reusable `BarChart` component uses D3’s `scaleLinear`, `scaleBand`, `axisLeft`, and `axisBottom` to compute scales and render axes into an SVG `<g>` element. The chart reads population data from a CSV file via `d3.csv`, and re-renders its SVG `<rect>` bars declaratively through React’s component model.
AI-generated descriptionA bare minimum HTML page.
MIT Licensed





Comments
Sign in to join the discussion.