🌍 Public
React and bar chart Black Box approach
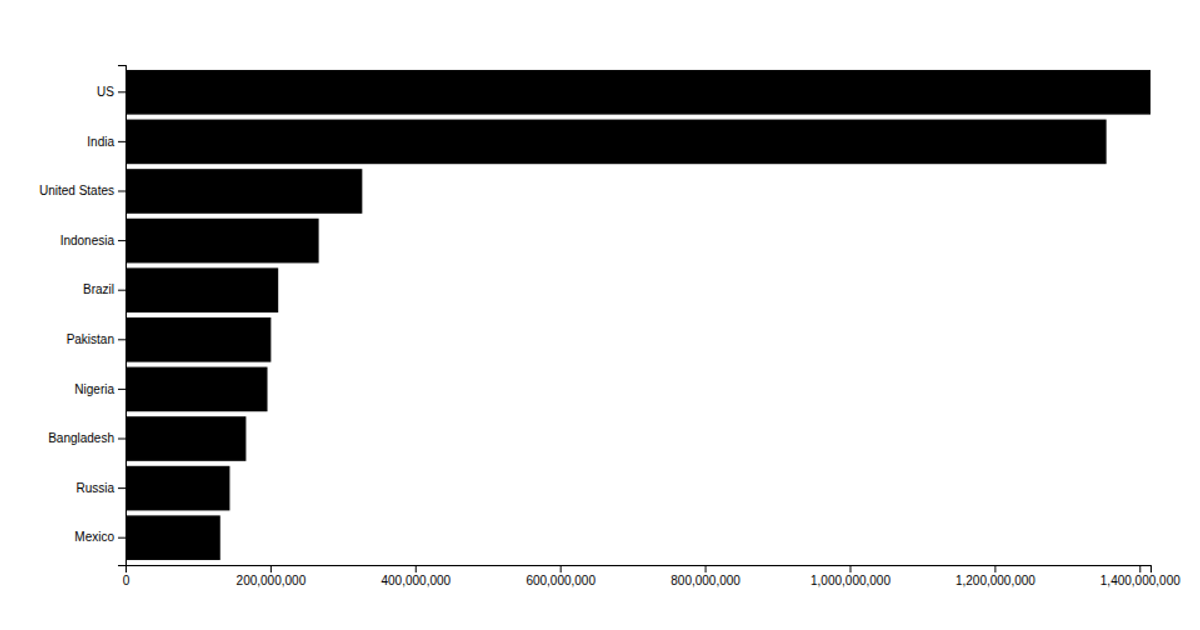
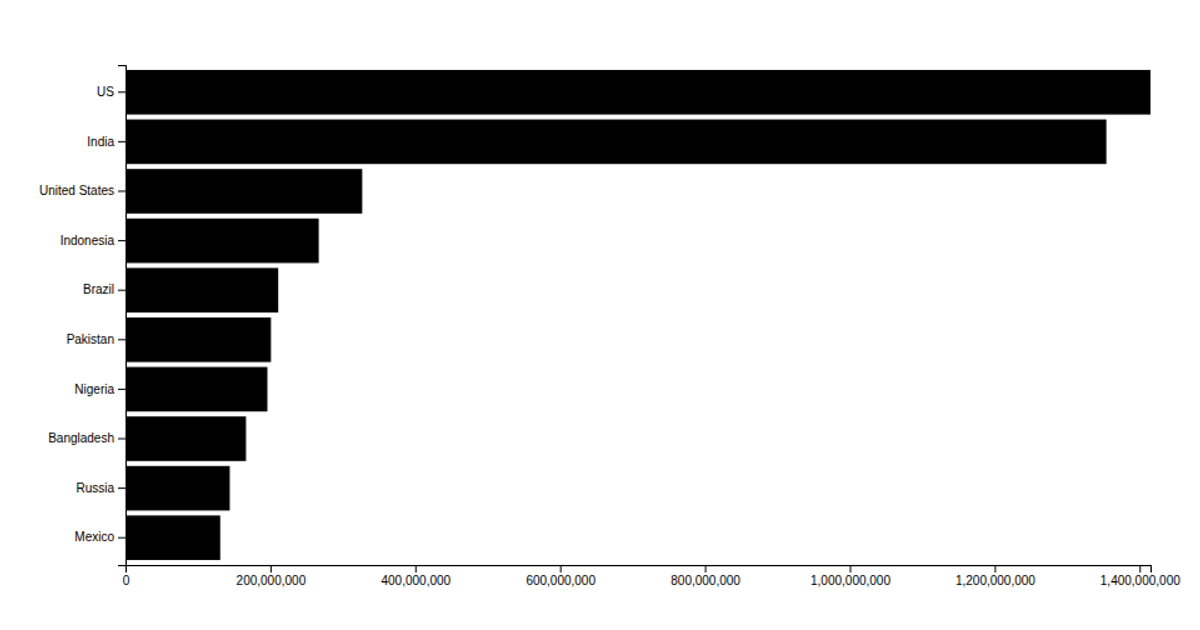
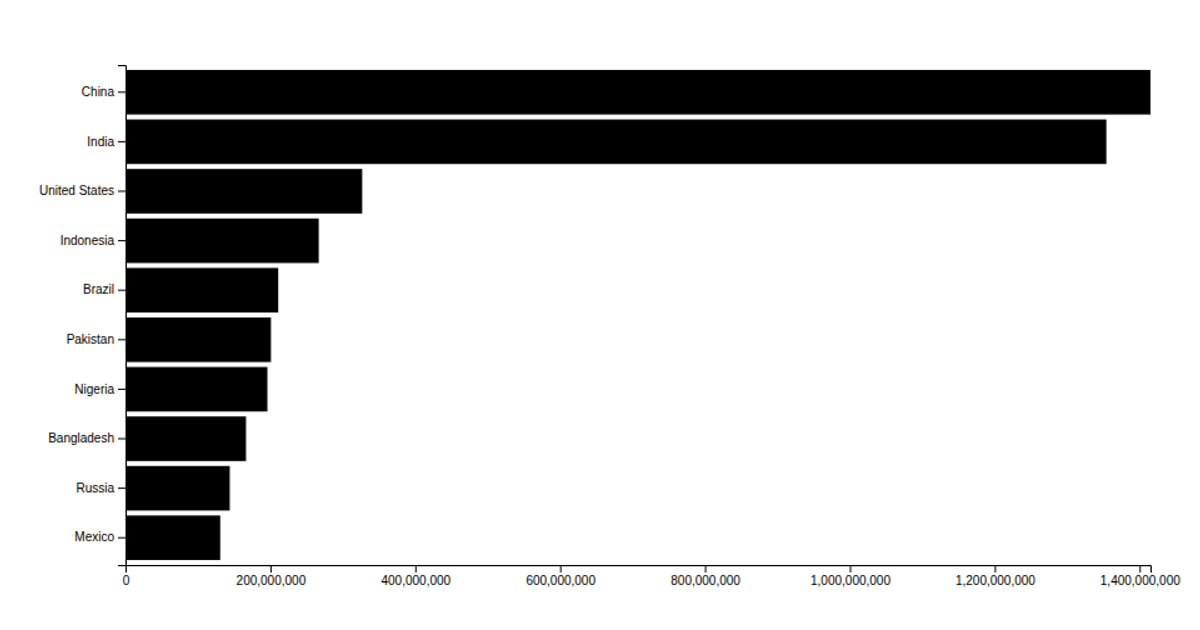
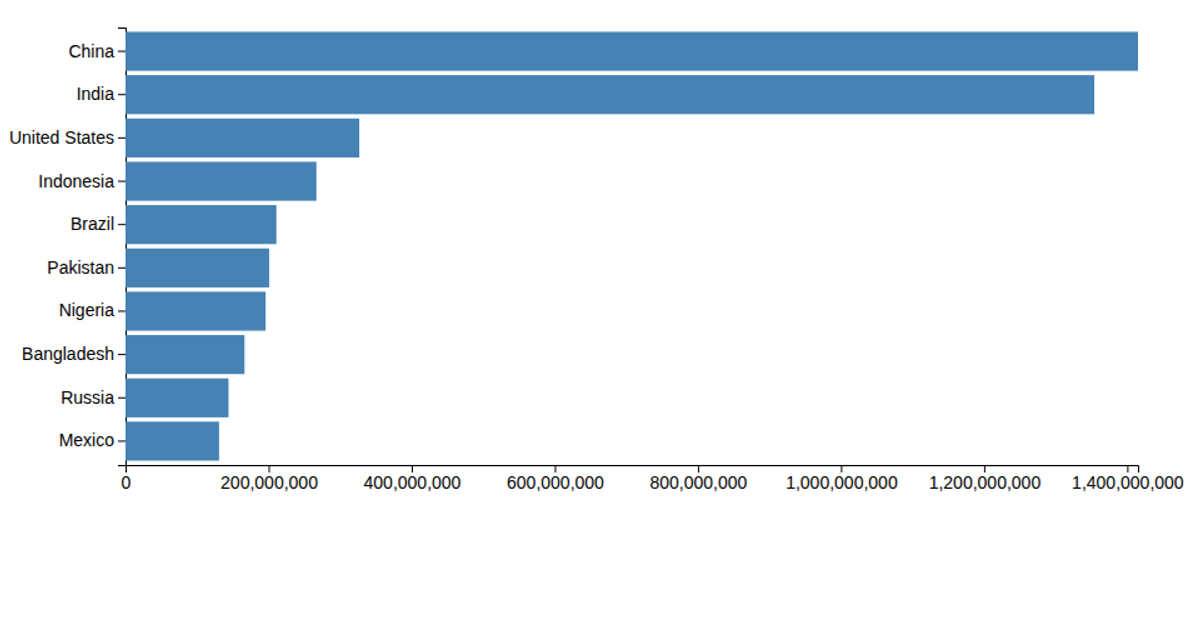
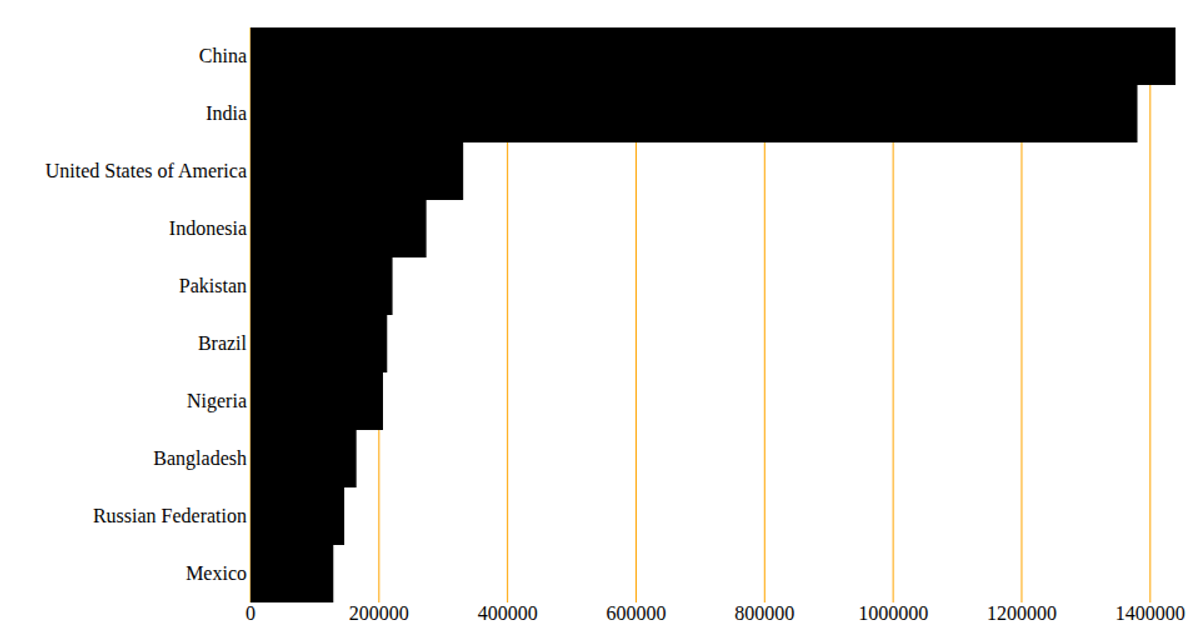
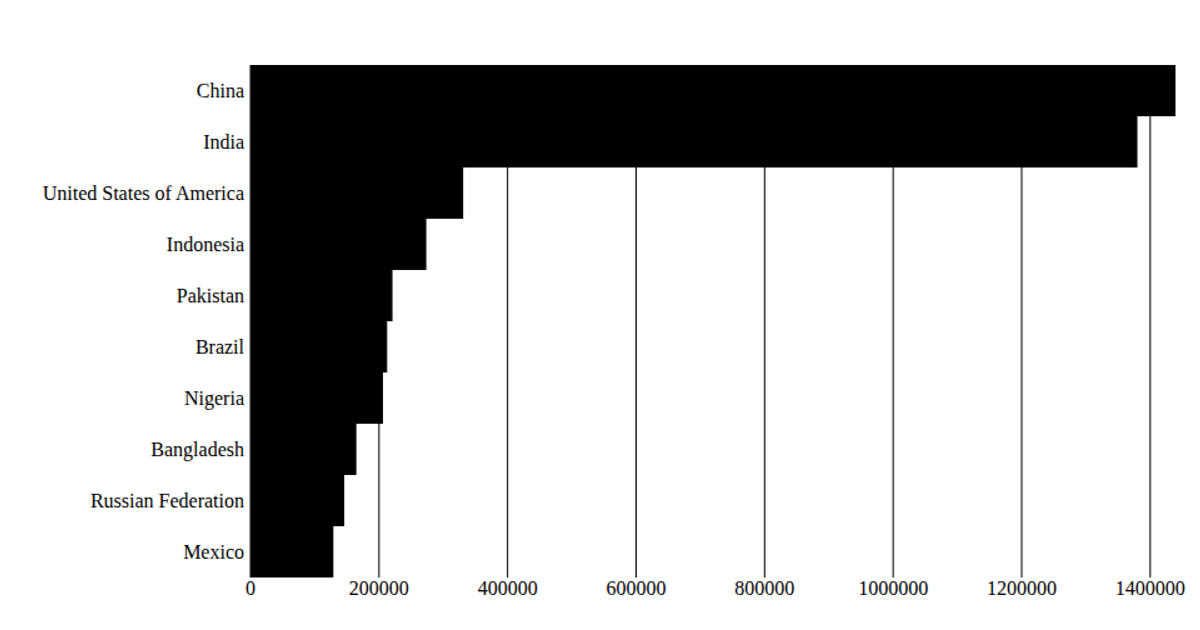
A bar chart displays population estimates for ten countries, sorted by country name along the y-axis and population count along the x-axis. Built with React and D3 v5, the visualization uses a black-box approach where D3 handles all SVG rendering inside a React component via a ref, while React manages the data-fetching lifecycle. The code loads data from a local CSV with `d3.csv`, scales values with `d3.scaleLinear` and `d3.scaleBand`, and draws axes using `d3.axisLeft` and `d3.axisBottom`.
AI-generated descriptionA bare minimum HTML page.
MIT Licensed


Comments
Sign in to join the discussion.