🌍 Public
Multi-view, directories, Missing Migrants(codeAlong)
Ttomahawk-jupiter
Last edited Jun 15, 2021
Created on Jun 11, 2021
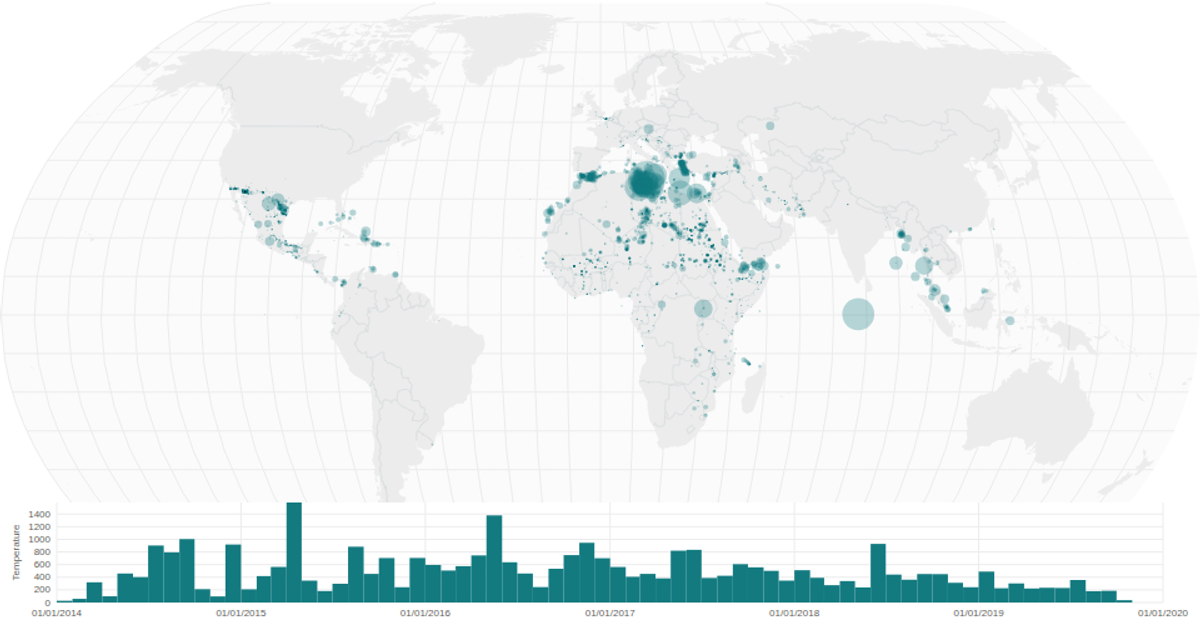
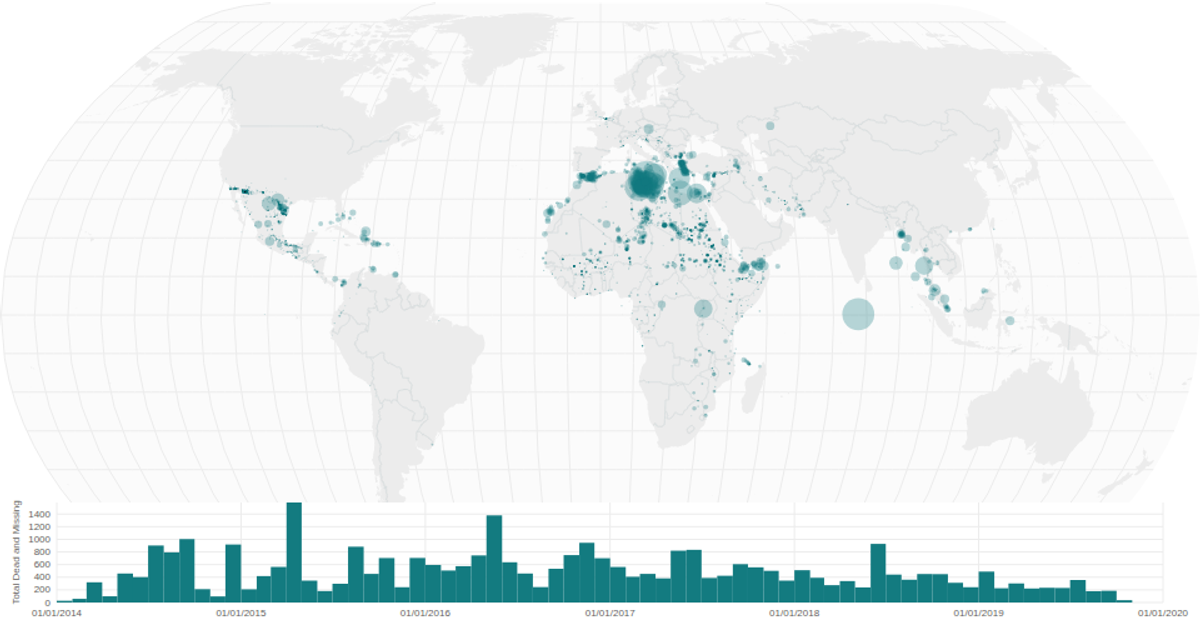
This multi-view visualization combines a natural Earth projection bubble map with a time-series histogram to explore missing migrant incidents. The map uses D3’s `geoNaturalEarth1`, `geoPath`, and `geoGraticule` to render world landmasses, with bubble size scaled by total dead and missing via `scaleSqrt`. A date histogram below bins reported dates by month using `bin` and `timeMonths`, aggregating counts with `sum`. Both views render as SVG within a React app, loading data from a CSV and world atlas TopoJSON file.
AI-generated descriptionLearning about directories to organize files.
tutorial Vid 9:56
MIT Licensed




Comments
Sign in to join the discussion.