🌍 Public
TASK.8_QUESTION-2_Sahith
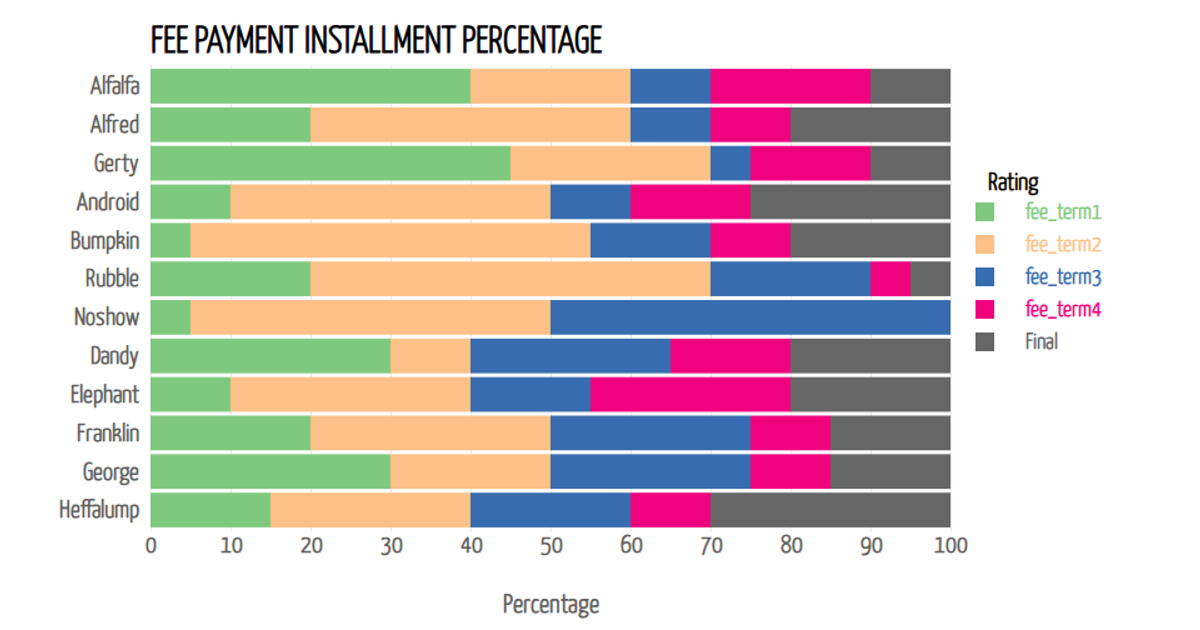
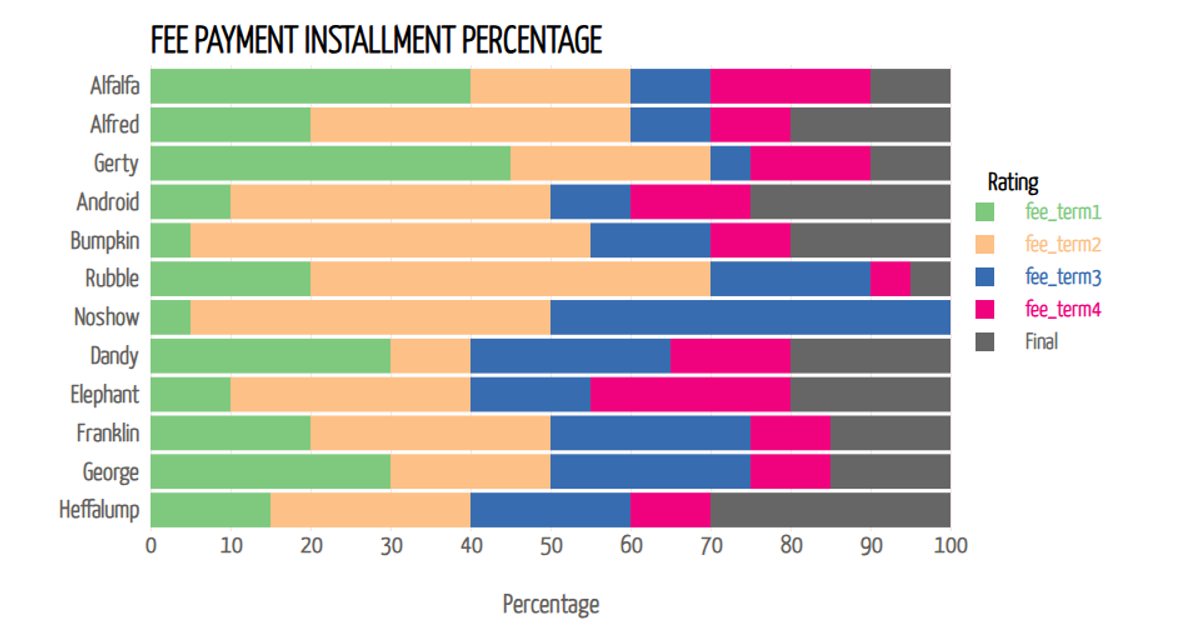
This example visualizes the percentage of fee payment installments across different age groups using a stacked horizontal bar chart. The chart draws from a CSV dataset containing demographic information about online food service users, including age, gender, income, and feedback. The visualization employs d3.stack() to layer the payment percentage data, with d3.scaleBand() and d3.scaleLinear() mapping the axes. Interactive tooltips appear on mouseover, displaying the exact percentage value for each age group, while a color-coded legend distinguishes the payment categories. The SVG rendering uses D3 v7 with custom styling from Google Fonts.
AI-generated descriptiononline foods
MIT Licensed




Comments
Sign in to join the discussion.