TASK.8_QUESTION-2_Sahith
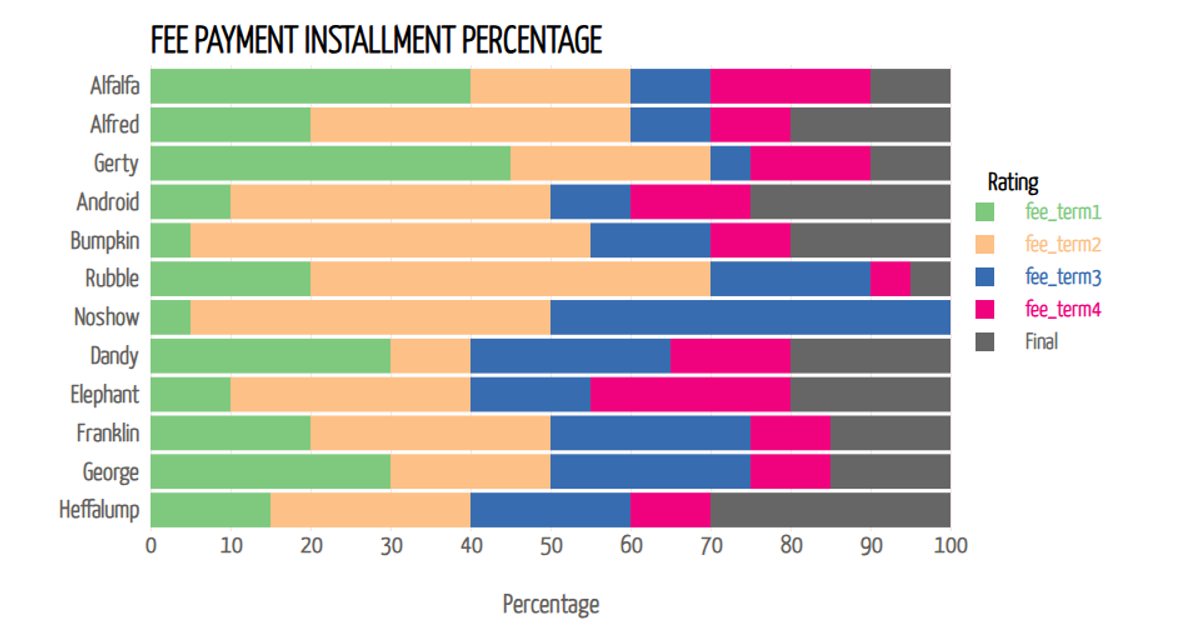
This stacked bar chart visualizes the percentage of total fee payment made across five installments by different students, grouped by occupation. Each bar segment represents a payment term, with the y-axis showing individual ages and the x-axis displaying percentage values. Hovering over a bar segment reveals a tooltip with the exact percentage paid during that term. The visualization is built with D3 v7, using d3.stack for data aggregation, d3.scaleOrdinal for color encoding, and SVG rendering with mouse event handlers for interactive tooltips.
AI-generated descriptionThe amount of fee paid students in 5 installments
This Stacked bar chart gives the percentage of total fee payment in each fee term by students. The aim is show the data on how much a each candidate is paying at the given point. when the mouse hovers over each bar, ypu can see pop=up of accurate percentage of each amount paid by a student at each term.





Comments
Sign in to join the discussion.