🌍 Public
Fork of VizHub Count Over Time
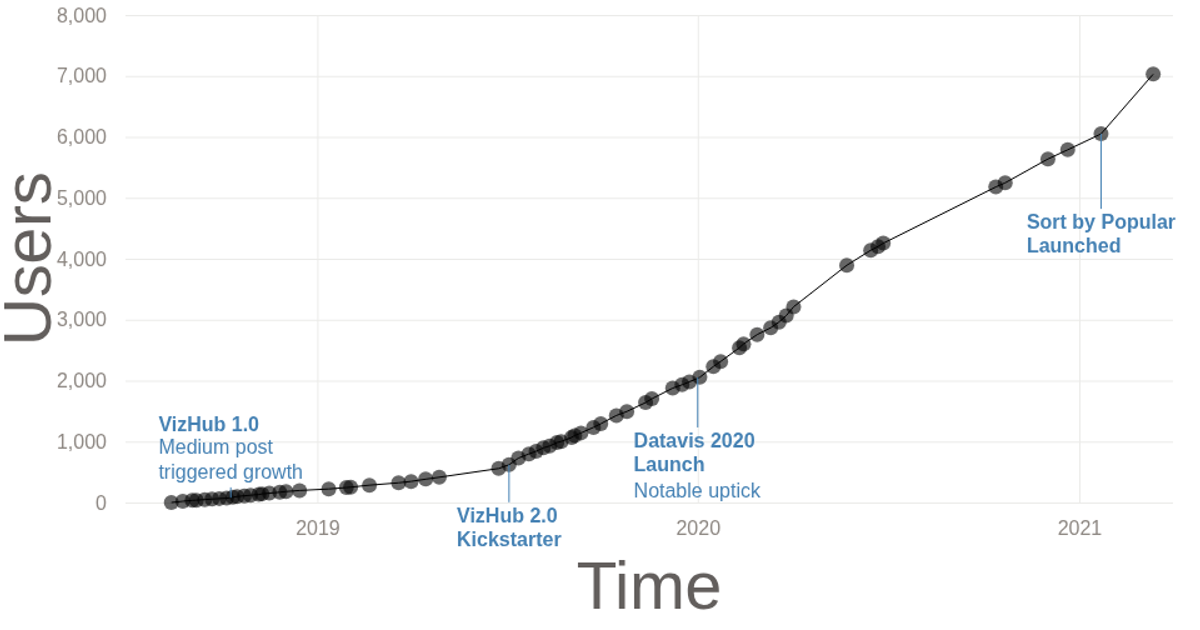
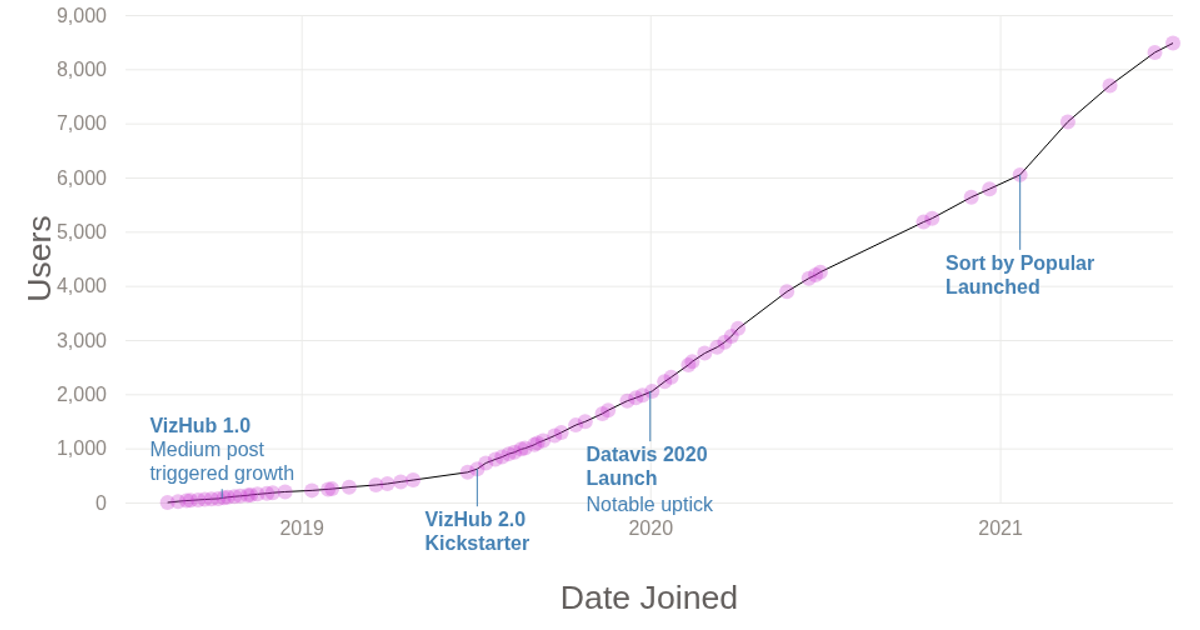
This line chart shows the cumulative growth of registered VizHub users from August 2018 to March 2022. The visualization uses d3.v4 with SVG rendering, a time-scaled x-axis and linear y-axis, and includes annotated notes marking significant events like the VizHub 1.0 launch and a Kickstarter campaign. Data comes from a CSV file with date and user count columns, and the chart employs d3.line and d3.axisBottom/axisLeft for the plot and axes.
AI-generated descriptionThe number of total unique logged in VizHub users over time, since it was launched on August 14, 2018.
See also index of courses.
MIT Licensed





Comments
Sign in to join the discussion.