🌍 Public
Fork of asg 2
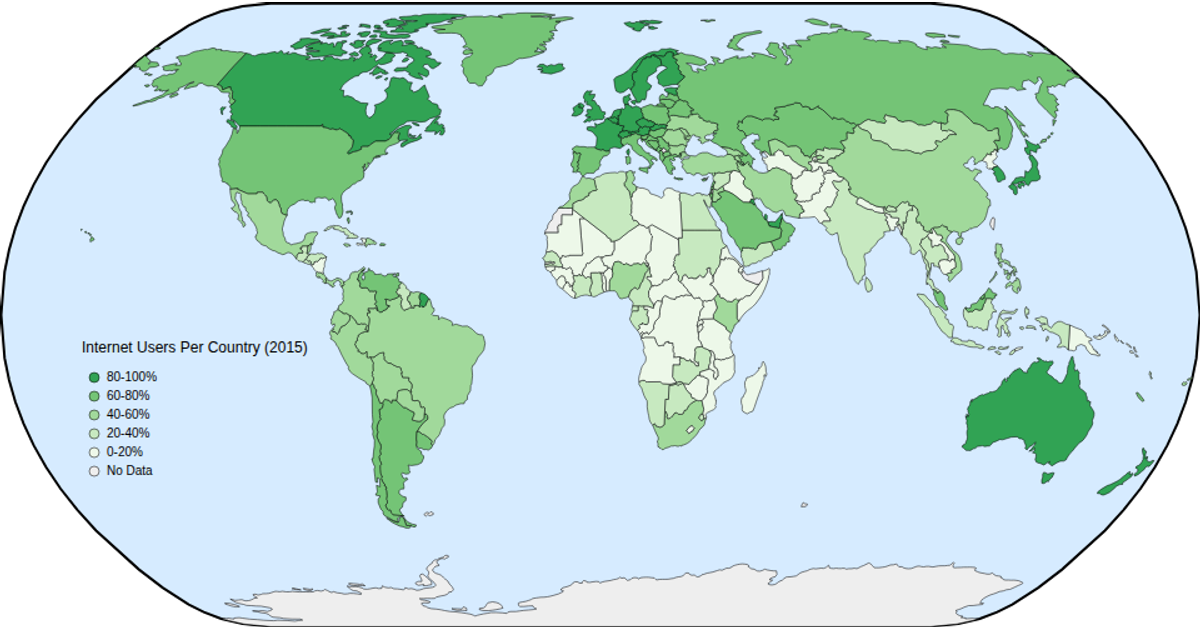
This interactive choropleth map visualizes global internet usage rates per country in 2015, with population data from Kaggle and country boundaries from a TopoJSON world atlas. Users can hover to see country names and usage statistics, zoom and pan via d3.zoom, and switch between years 2018–2022 through a dropdown menu. The map uses d3.geoNaturalEarth1 projections, d3.geoPath, and a sequential color scale based on d3.schemeGreens to encode population ranges.
AI-generated descriptionA 2015 world map of Internet Users Dataset. This iteration adds hover and zoom.
MIT Licensed


Comments
Sign in to join the discussion.