🌍 Public
Fork of 2015 Internet Users World Map
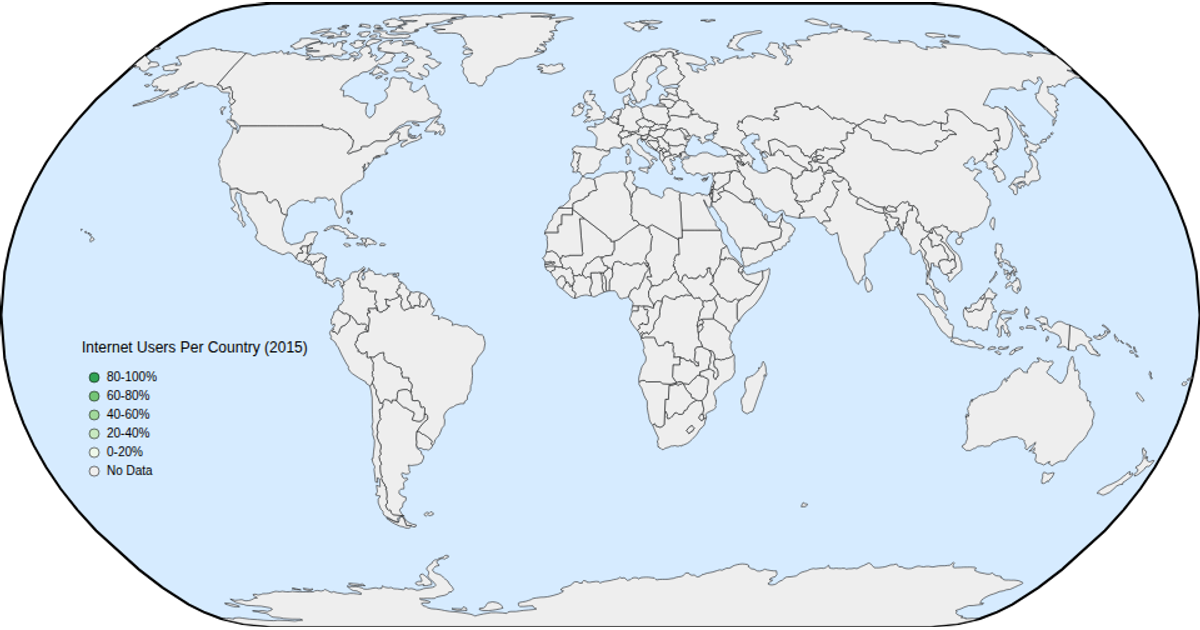
This example displays a world map of internet users per 100 people in 2015, with countries colored on a green scale by percentage and a legend explaining the ranges. Hovering over a country reveals its name and percentage, and the map supports zooming and panning. The visualization loads geographic data from a TopoJSON atlas and joins it with a CSV dataset, using D3’s `geoNaturalEarth1` projection, `geoPath`, and `d3.zoom` for interaction.
AI-generated descriptionA 2015 world map of Internet Users Dataset. This iteration adds hover and zoom.
MIT Licensed




Comments
Sign in to join the discussion.