🌍 Public
Visualização de gráfico de dispersão v3
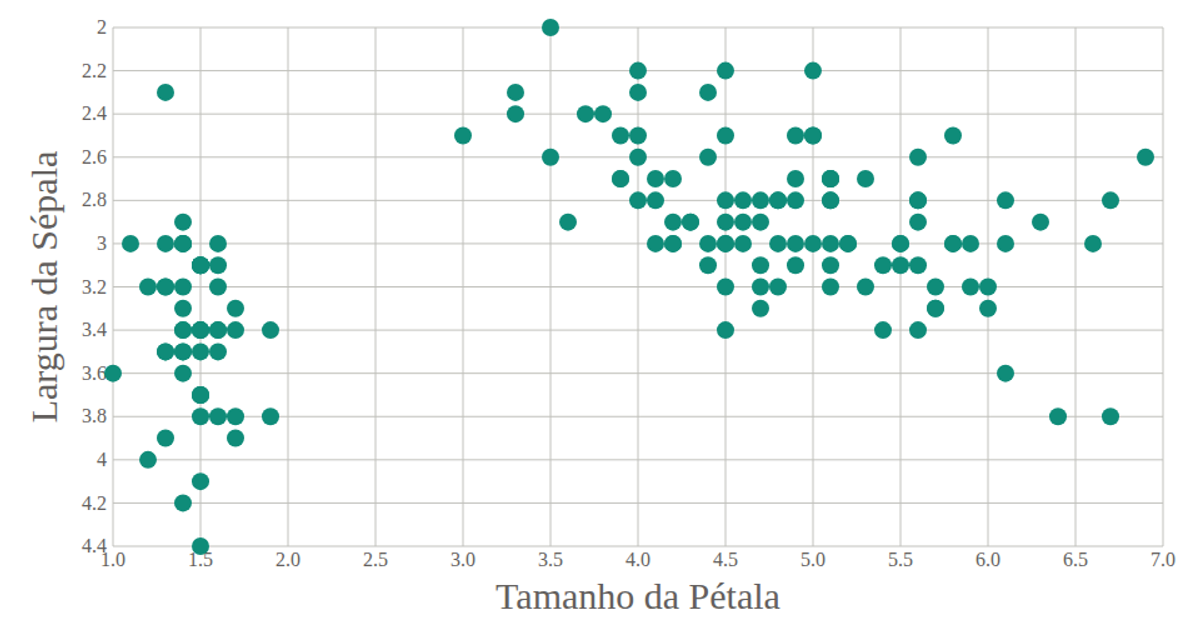
A scatter plot of the Iris dataset, with dropdown menus to select which flower measurements appear on the X and Y axes. The visualization renders SVG circles for each data point, using scales generated with `d3.scaleLinear` and `d3.extent`, with axes drawn from the `AxisBottom` and `AxisLeft` components. The React app manages the selected attributes via `useState`, and the data is loaded asynchronously with `d3.csv` from a GitHub gist.
AI-generated descriptionVisualização de gráfico de dispersão v1
MIT Licensed


Comments
Sign in to join the discussion.