🌍 Public
Visualização de gráfico de dispersão v1
Xxilingus
Last edited Oct 28, 2021
Created on Oct 28, 2021
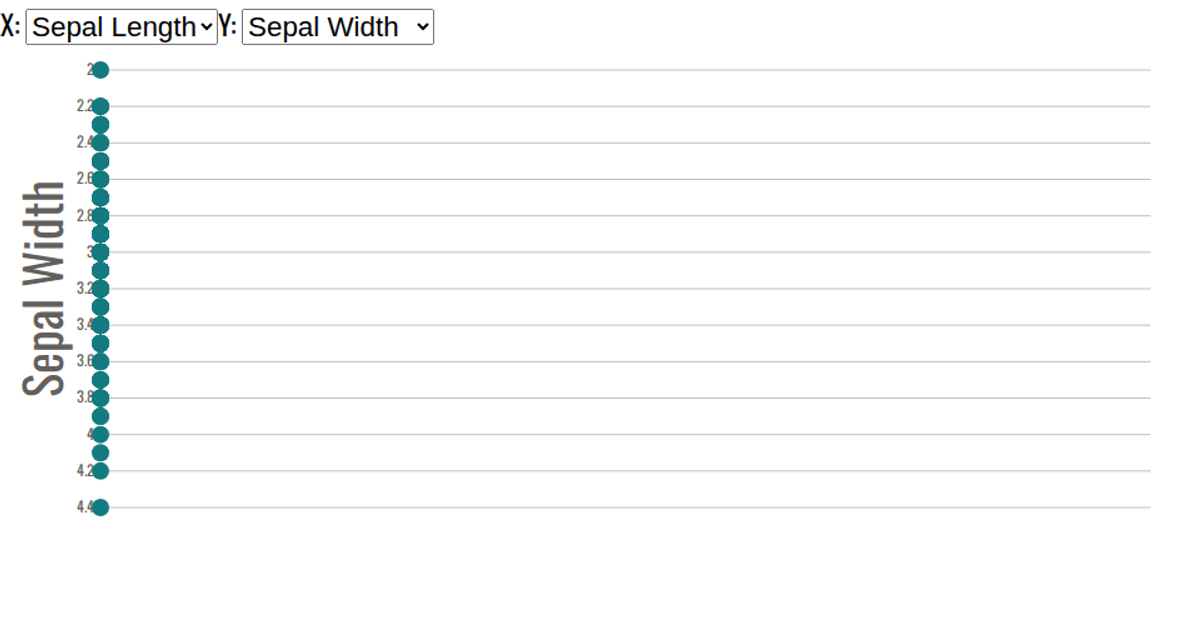
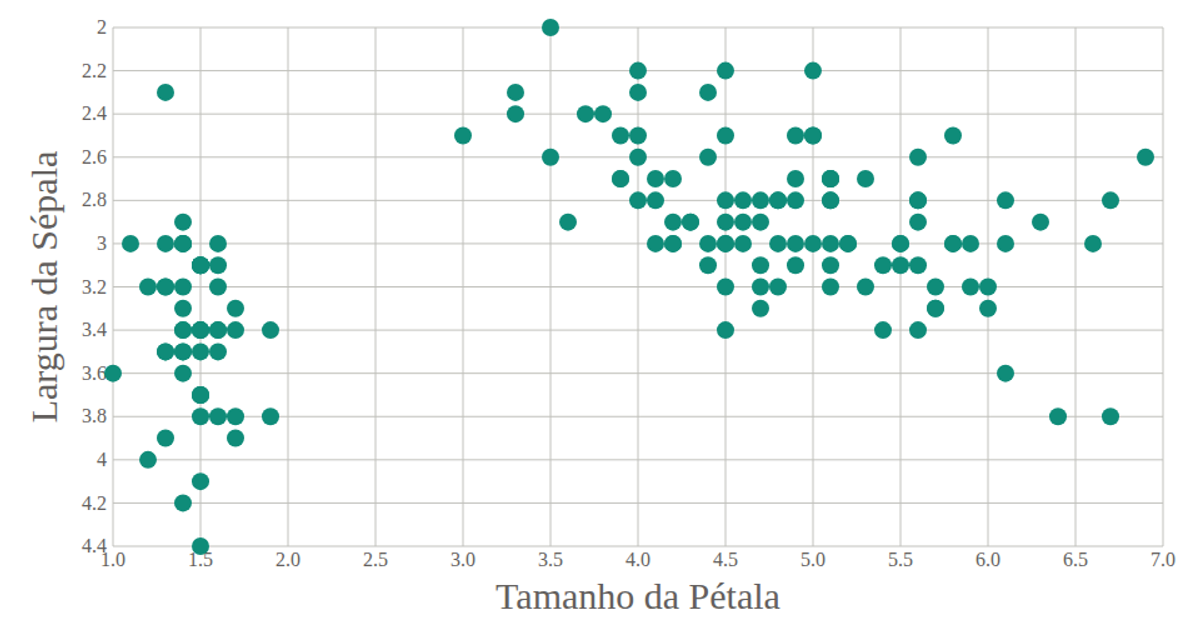
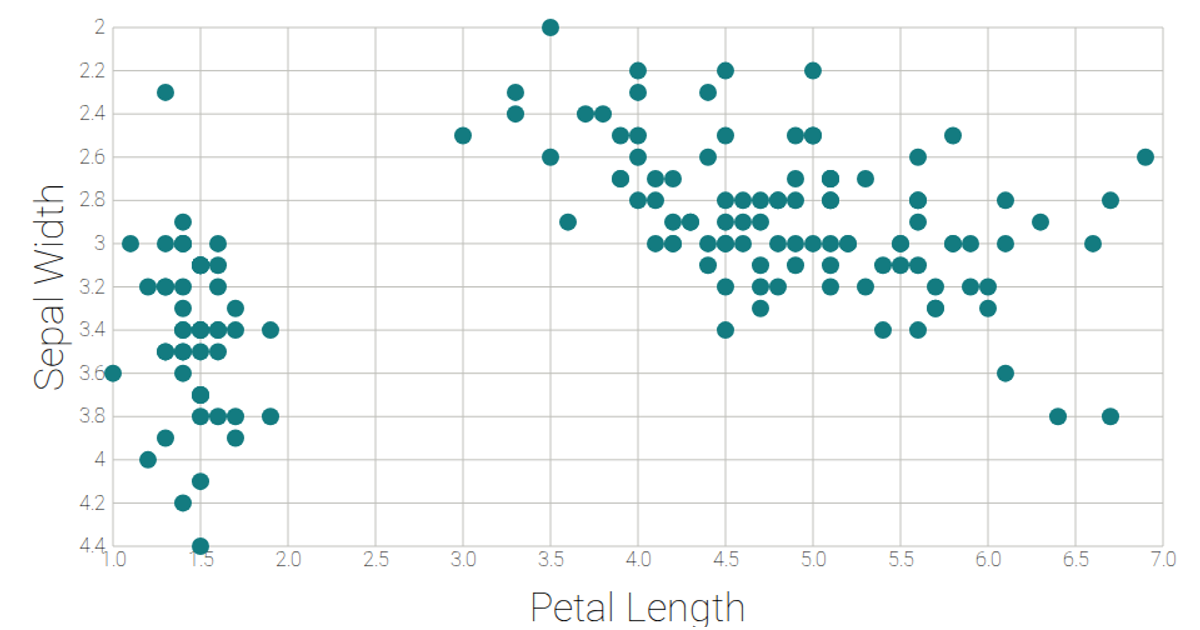
This scatter plot visualizes the sepal length and sepal width of iris flowers from a CSV dataset. It uses the D3.js `scaleLinear` API to map the data’s extent to the SVG canvas, with axes and tick marks generated by custom React components. Circle marks are positioned using `xScale` and `yScale`, and each includes a `<title>` tooltip. The visualization is rendered with React and D3 v5, using SVG elements and Oswald font styling.
AI-generated descriptionVisualização de gráfico de dispersão v1
MIT Licensed





Comments
Sign in to join the discussion.