🌍 Public
Assignment8_sowjanya_world map
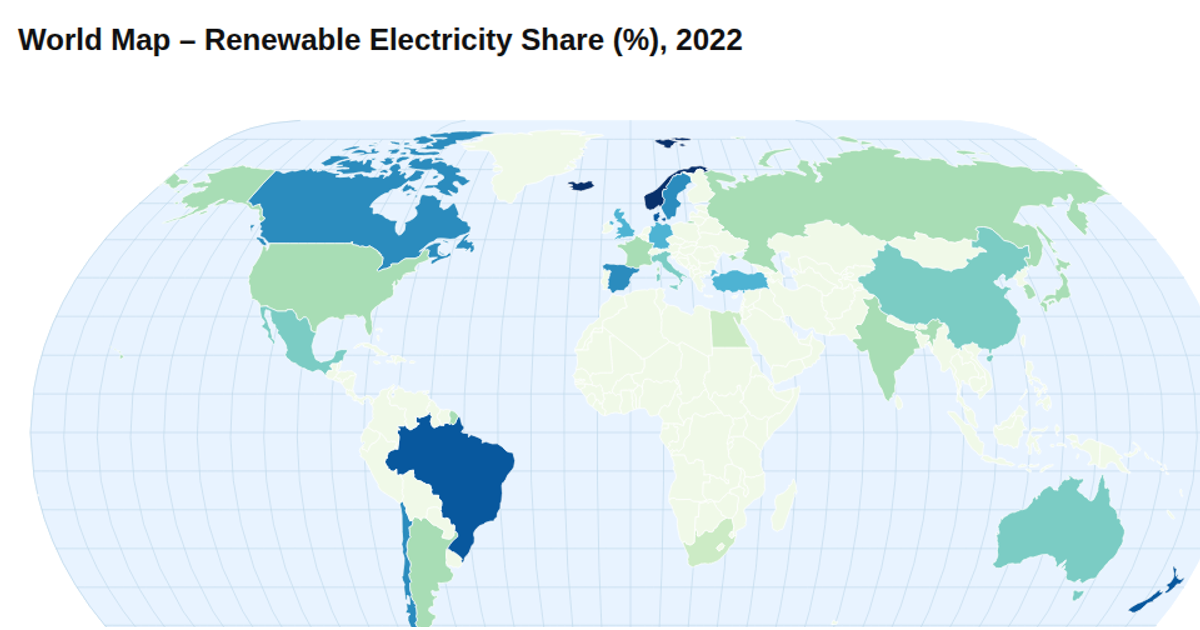
This choropleth maps internet user percentages by country for 2023 using a pastel threshold color scale with custom class breaks. Natural Earth projection via `d3.geoNaturalEarth1` and `d3.geoPath` render country boundaries over a graticule, with a custom tooltip showing values on mouseover. The visualization loads TopoJSON world geometry from world-atlas and CSV internet usage data, then applies the threshold scale to fill each country, accompanied by a horizontal legend. The map is built with D3 v7, rendering to SVG with HTML div-based tooltips.
AI-generated descriptionMIT Licensed




Comments
Sign in to join the discussion.