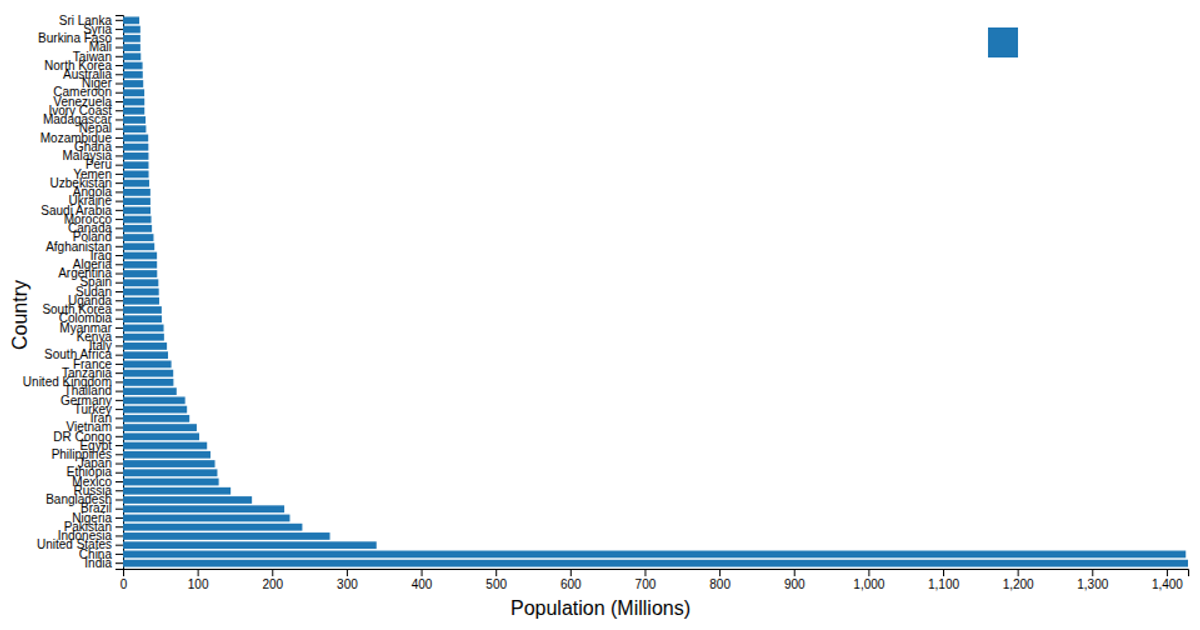
Horizontal bar chart that represents the population of various countries in millions.
This horizontal bar chart displays the 2023 population estimates for various countries in millions, ordered from smallest at the top to largest at the bottom. The chart uses a linear scale for the x-axis representing population figures, while the y-axis lists countries in descending order. Built with D3.js, the visualization uses `scaleLinear` for axes, `scaleBand` for the categorical country labels, and `flatRollup` to preprocess the CSV data. A color legend provides interactive filtering, dimming non-hovered bars when the user explores specific countries.
AI-generated descriptionGraph Overview
Type: Horizontal Bar Chart Purpose: Displays the population of various countries measured in millions. Orientation: Countries with smaller populations are at the top, and those with larger populations are at the bottom.
Data Representation
X-Axis: Represents population figures, ranging from 0 to 1,400 million. Y-Axis: Lists countries in descending order of population. Bars: The length of each bar indicates the country's population in million.





Comments
Sign in to join the discussion.