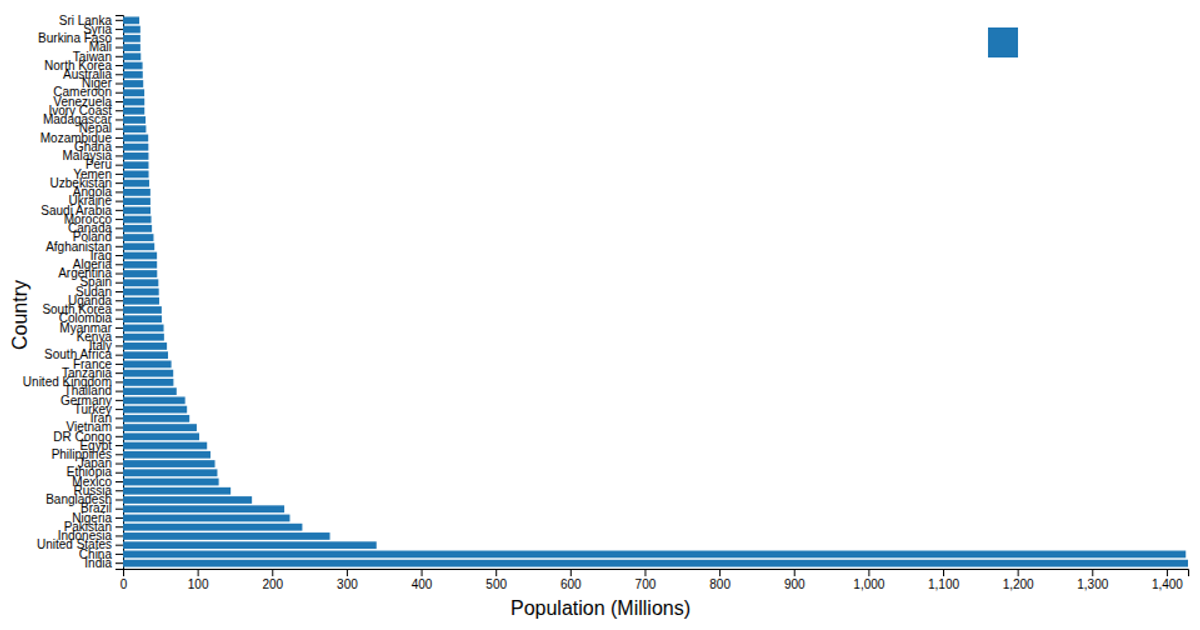
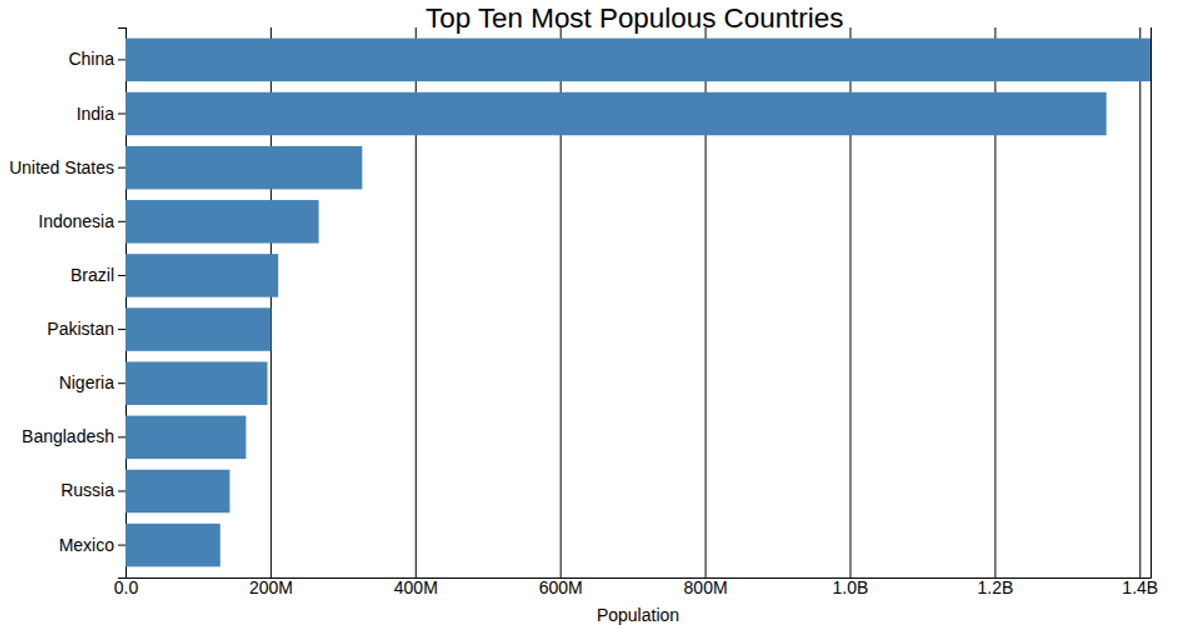
Horizontal bar chart that represents the population of various countries in millions
This horizontal bar chart displays the population in millions for the top 20 most populous countries, using D3’s `scaleLinear` and `scaleBand` to map values to positions. Users can hover over the legend to highlight a specific country’s bar. The visualization leverages the `stackedBarChart` module, which employs `flatRollup` and `stack` to process the data. Population figures are drawn from the `covidandworldpopulation.csv` file, which contains data from the Pew Research Global Religious Landscape project.
AI-generated descriptionStacked bars showing estimated religion breakdown of the most populous 20 countries in 2010. Based on an example from the tutorial Splitting Charts. Interactions:
- Hover over the legend to highlight religions.
Data is from The Global Religious Landscape by Pew Research, generated using this processing script.






Comments
Sign in to join the discussion.