🌍 Public
Untitled
Ddevansh1407
Last edited Apr 10, 2023
Created on Apr 10, 2023
Forked from Fork of Fork of Fork of Fork of HTML Starter
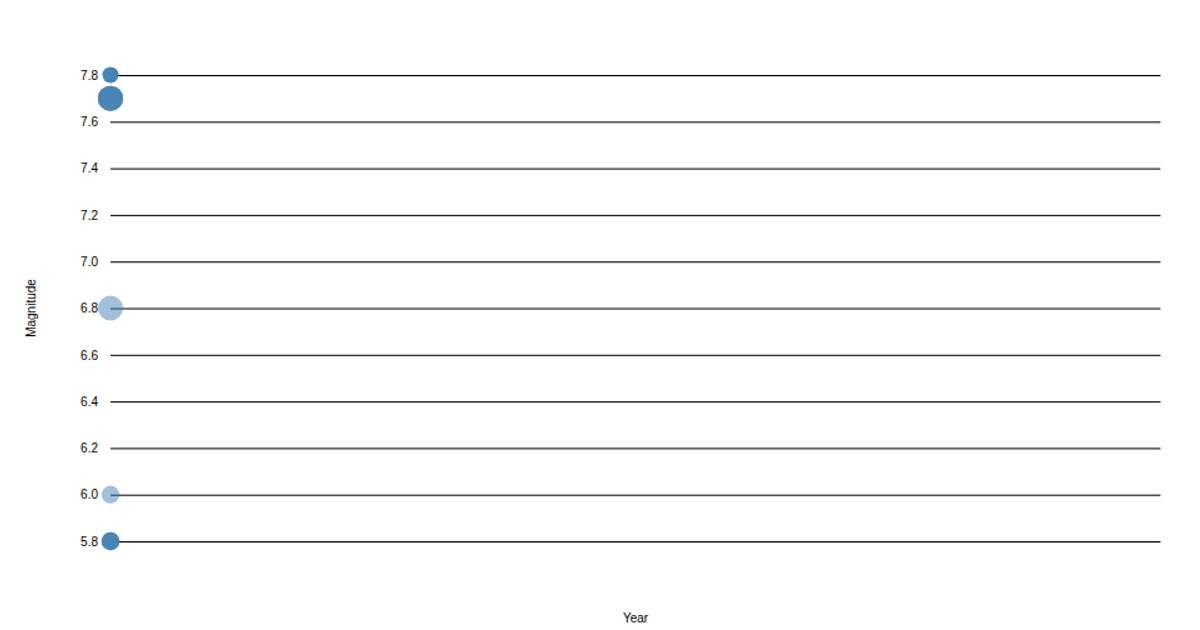
This example visualizes earthquake locations using a global map rendered with D3’s `d3.geoPath` and `d3.geoOrthographic` projections. It plots seismic events as circles whose size and color encode magnitude, with a color scale from `d3.scaleSequential`. The visualization updates over time by cycling through timestamped data, using `d3.transition` to animate circle radius changes. It relies on the TopoJSON world atlas for geographic boundaries and fetches earthquake data from a local CSV file.
AI-generated descriptionMIT Licensed




Comments
Sign in to join the discussion.