🌍 Public
activity 6_Task 1
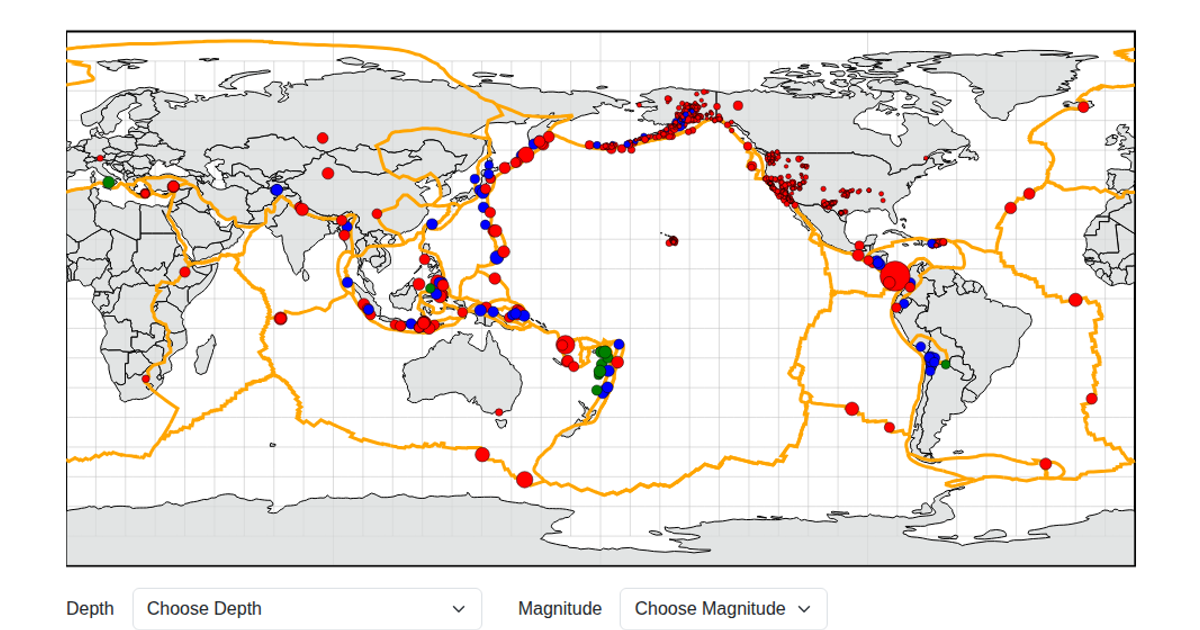
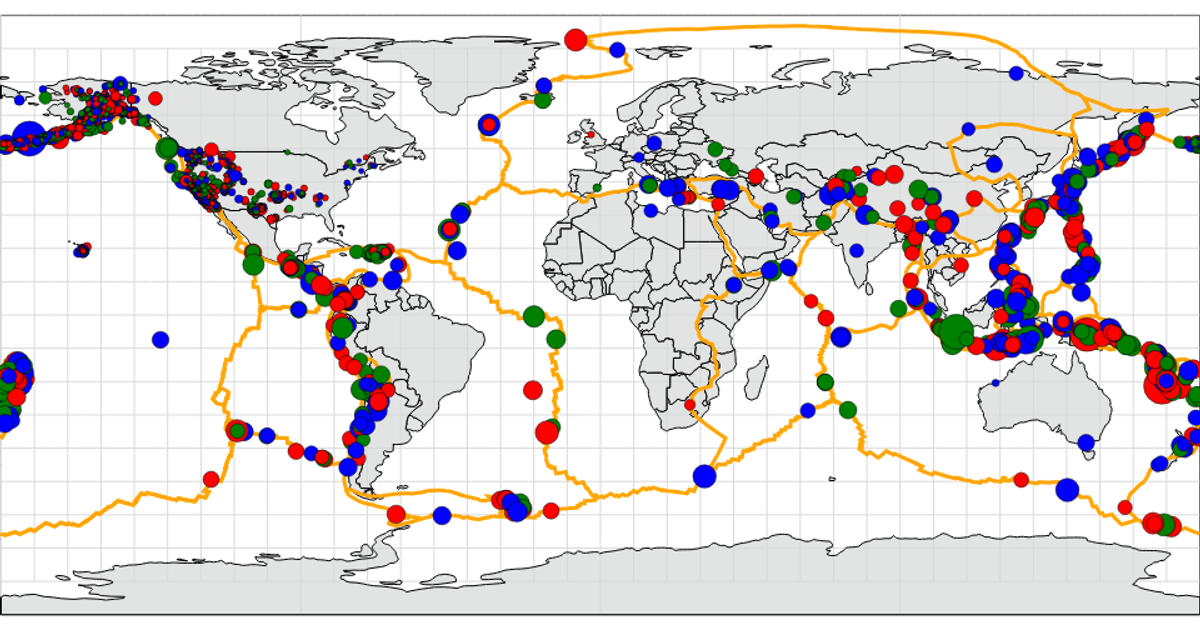
This interactive map of global earthquake activity reveals the network of seismic events over time, with circles sized by magnitude and colored by depth. The visualization uses D3.js’s `d3.select` and `d3.scale` for data-driven encodings, while geographic boundaries are drawn via `d3.geoPath` from GeoJSON data. Earthquakes are rendered as animated points summoned from the USGS live feed, highlighting the planet’s restless tectonic boundaries.
AI-generated descriptionMIT Licensed






Comments
Sign in to join the discussion.