🌍 Public
Simple Bar Chart
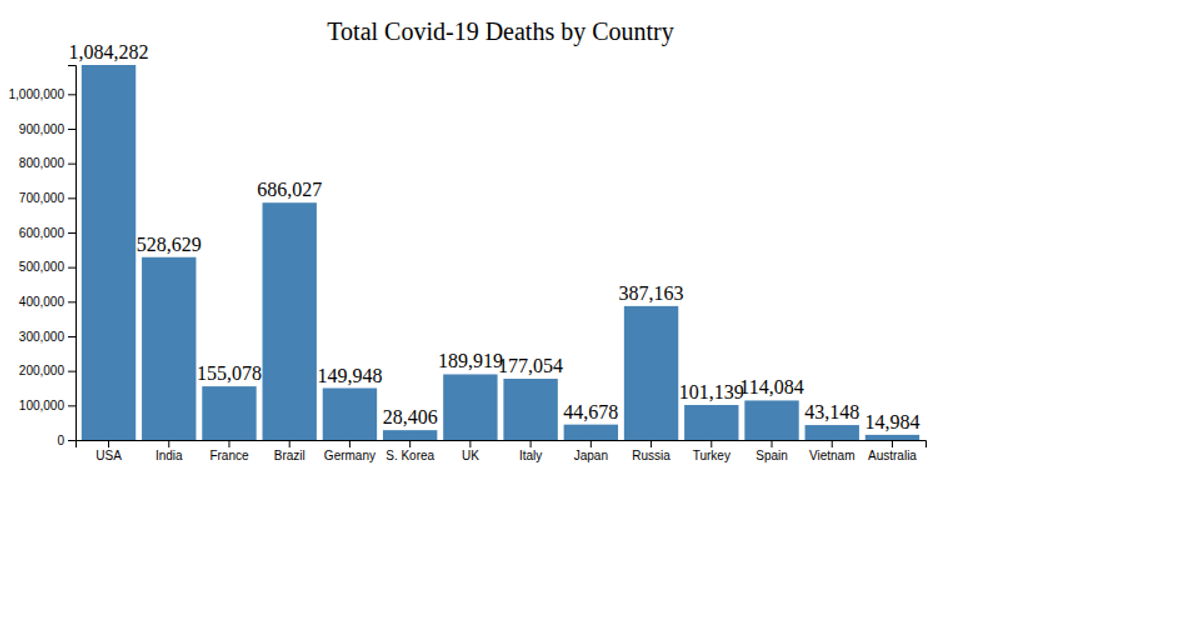
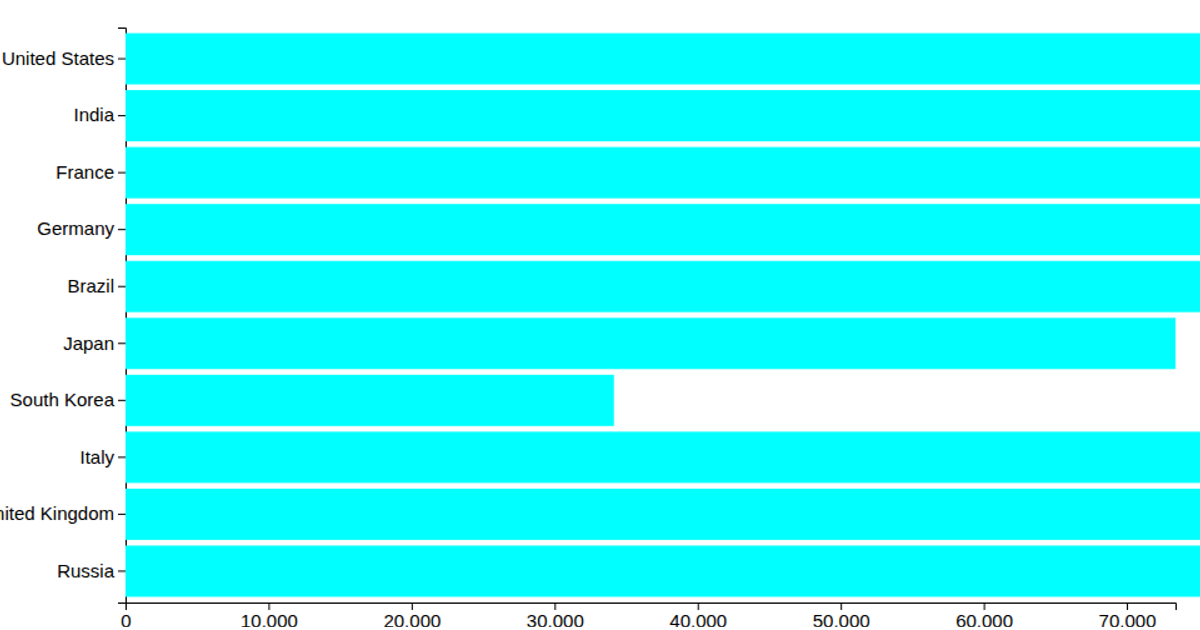
This bar chart displays the number of deaths reported by countries in June 2021, filtered to values greater than 5,000 from the World Mortality Dataset. It uses D3.js v6 with SVG rendering, employing `scaleLinear` and `scaleBand` to map death counts and country names, along with `axisBottom` and `axisLeft` for the axes. The dataset is loaded via `d3.csv` from a GitHub Gist, and the chart resizes to the full browser window.
AI-generated descriptionA Bar plot with D3
This visualization shows World Mortality Dataset. It visualizes countries with their number of deaths (greater than 5000) reported in June, 2021.
MIT Licensed






Comments
Sign in to join the discussion.