A Bar plot with D3
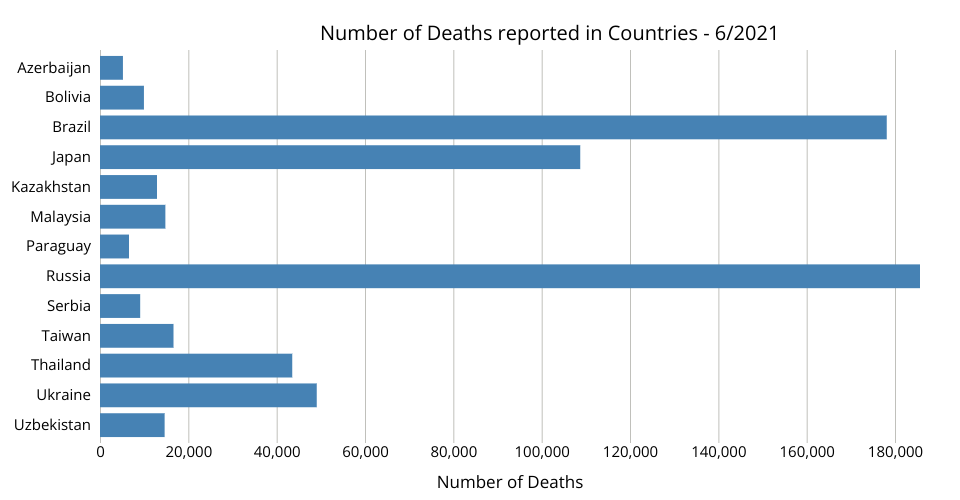
This visualization shows World Mortality Dataset. It visualizes countries with their number of deaths (greater than 5000) reported in June, 2021.
MIT Licensed
A Bar plot with D3
This visualization shows World Mortality Dataset. It visualizes countries with their number of deaths (greater than 5000) reported in June, 2021.