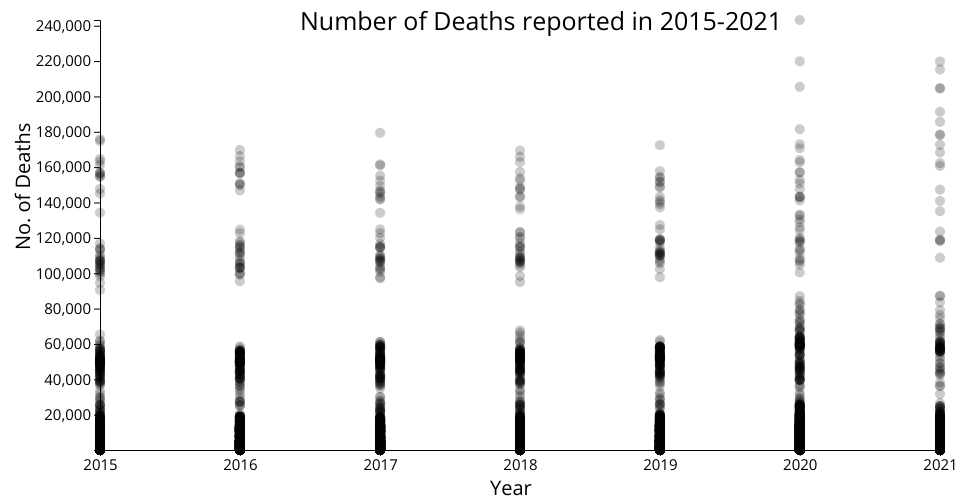
A scatter plot with D3 with Time Scale on X-axis
This visualization shows World Mortality Dataset. It visualizes the number of deaths reported from year 2015 to 2021 across all countries. Each circle represents a country in a given year.
MIT Licensed