🌍 Public
Fork of Line Chart
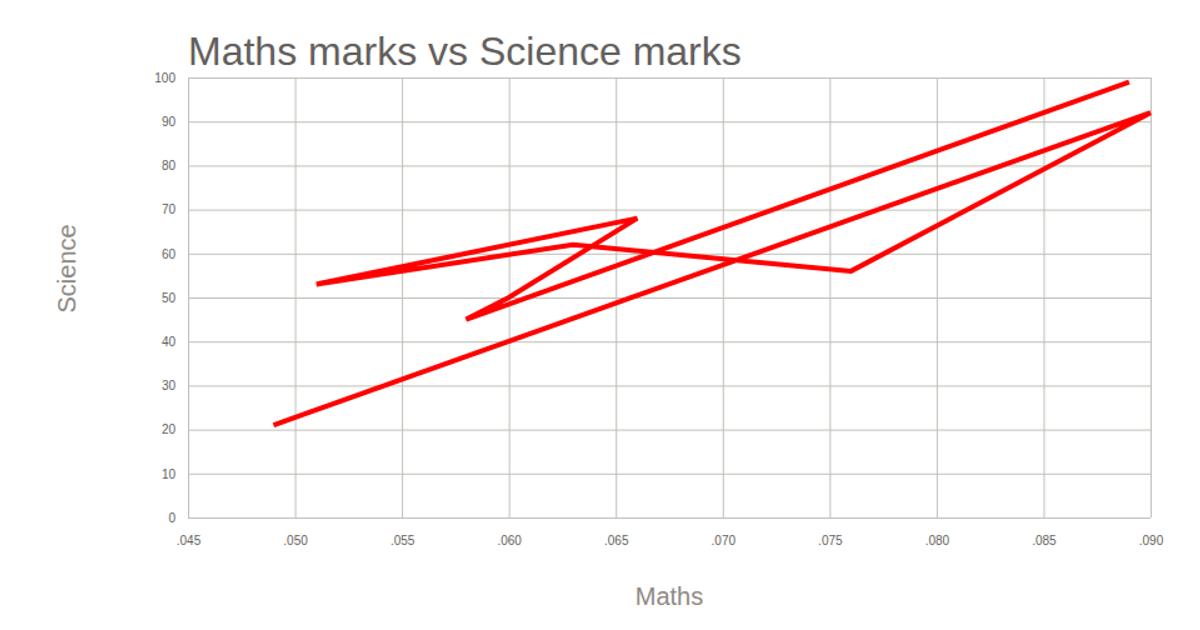
This fork of a line chart displays a single red data series against a clean, minimalist background. The SVG visualization relies on D3.js v5 to generate the axes and grid lines, with tick labels and axis titles styled via CSS. The chart’s line is rendered as a thick red path, while the overall presentation is centered on the page, using a sans-serif font for readability. The code imports D3 from a CDN and applies the styling from an external stylesheet.
AI-generated descriptionMIT Licensed





Comments
Sign in to join the discussion.