🌍 Public
Fork of line chart
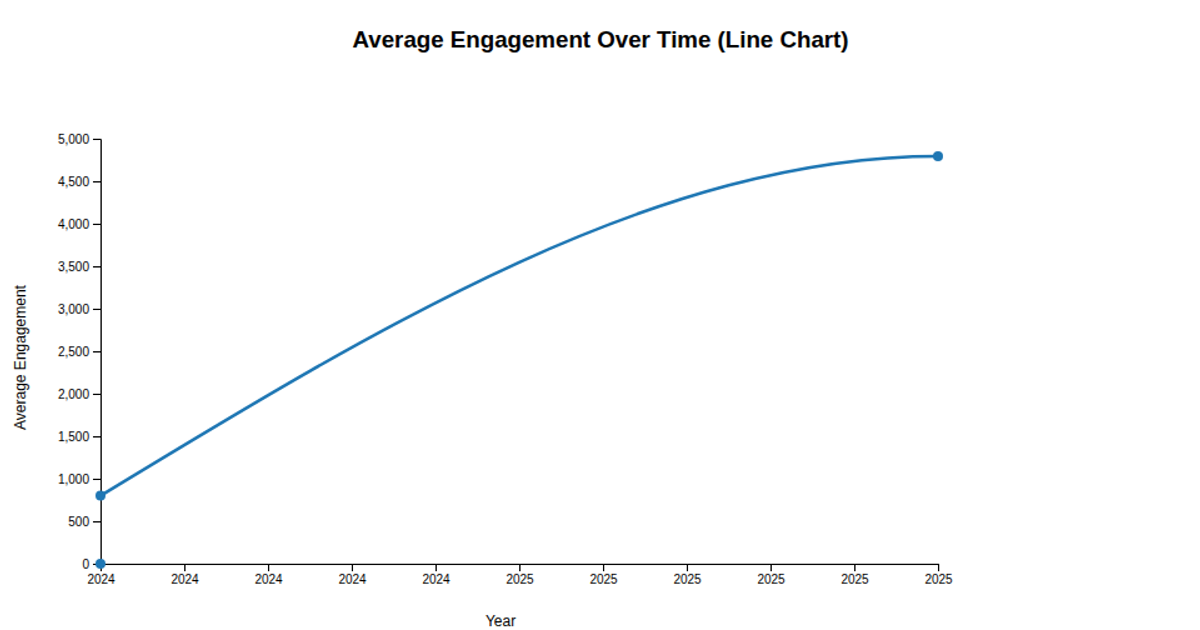
This example demonstrates a forked implementation of a basic line chart using D3.js version 3. The visualization renders a simple line plot that maps data points across an x-y coordinate system, with the chart’s axes and path generated through D3’s `d3.svg.line()` and `d3.scale.linear()` APIs. The code constructs the SVG elements dynamically, tying scales to the data domain and range. However, the actual data series and interactive behaviors are not defined in the visible files, leaving the chart as a template that would be populated with data for full rendering.
AI-generated descriptionMIT Licensed



Comments
Sign in to join the discussion.