🌍 Public
Final Stacked Bar Chart with HTML and movable filter
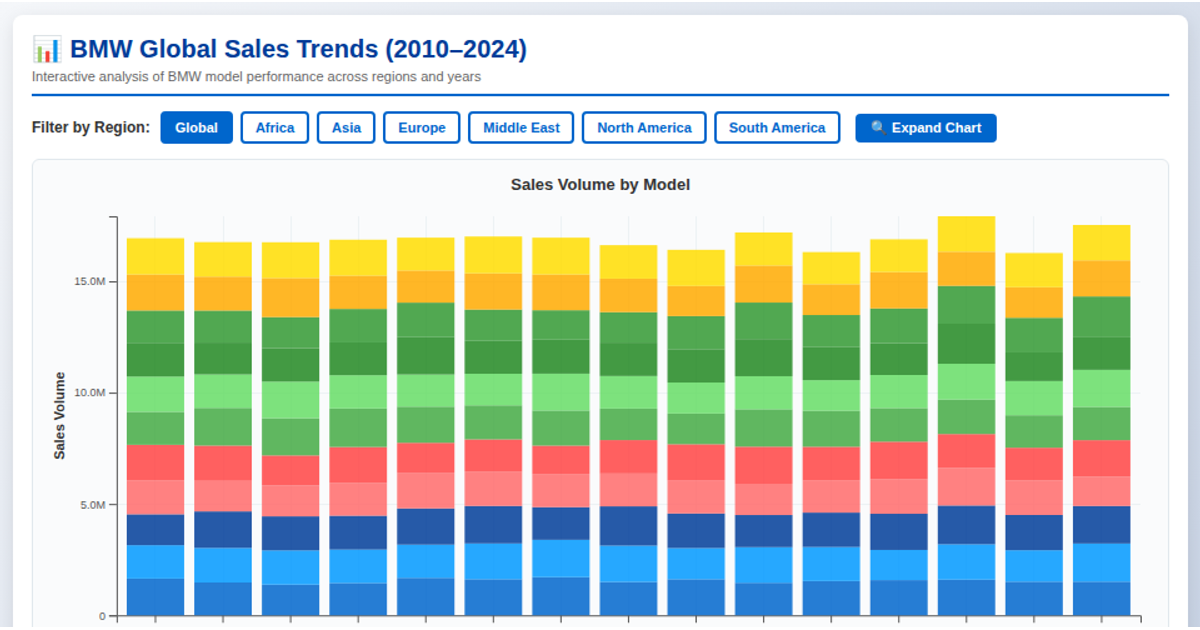
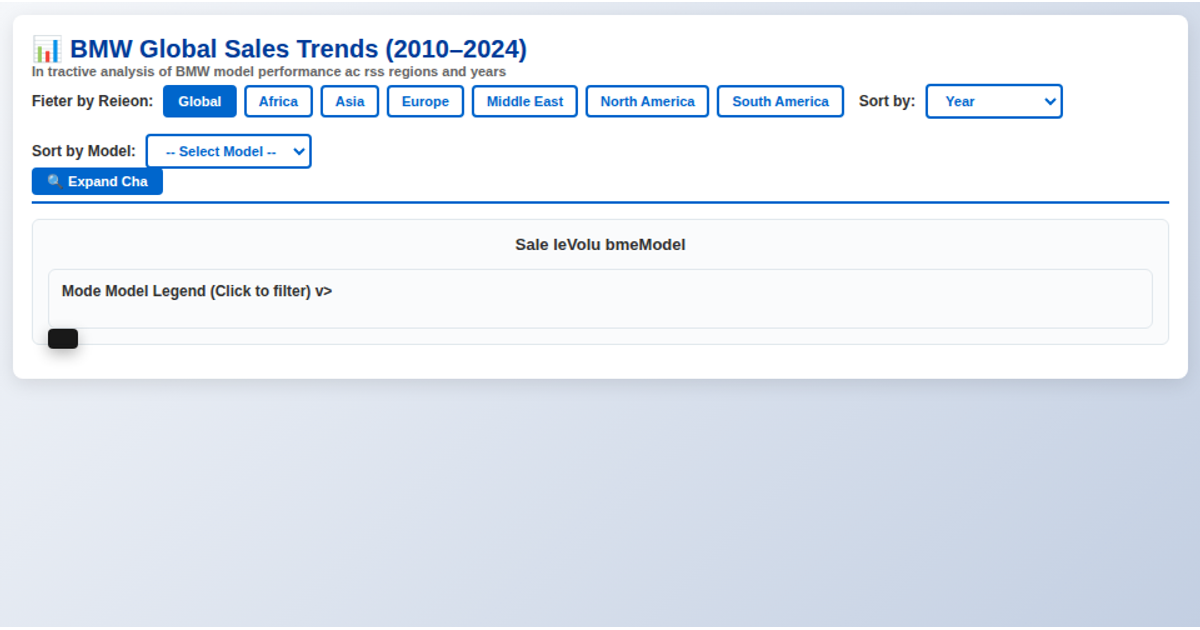
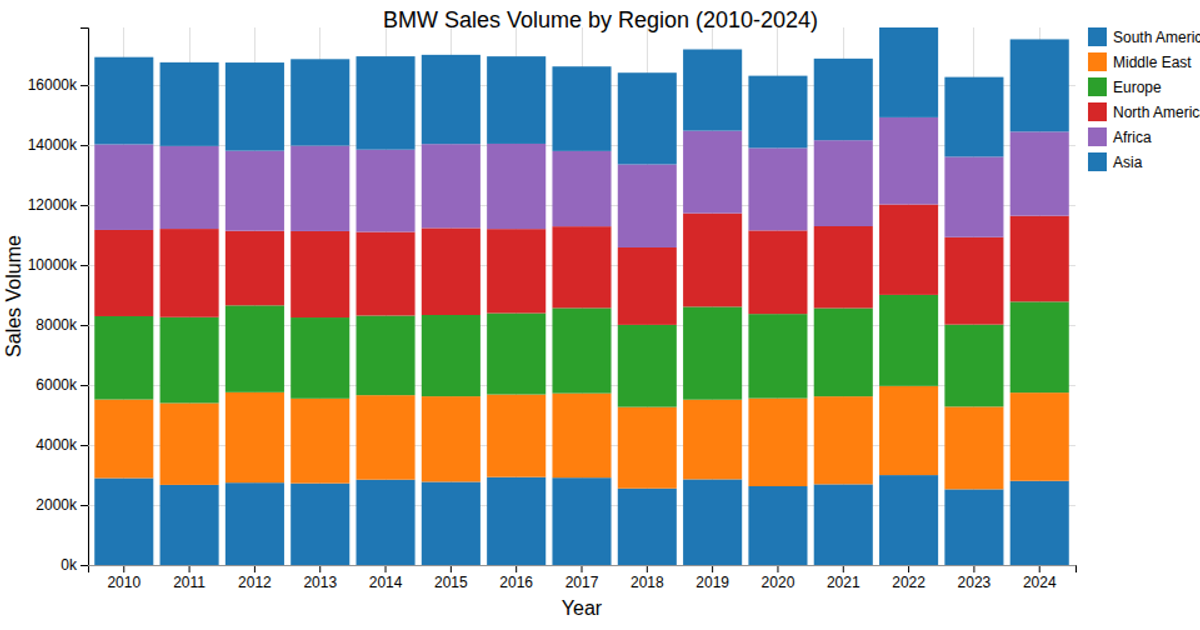
This interactive D3.js v7 visualization presents a stacked bar chart of BMW model sales volumes by model and year. Users can filter the view through a movable dropdown menu to highlight either the highest or lowest selling model. The SVG-based chart uses `d3.rollups` for data aggregation, `d3.stack` for stacking, and `d3.scaleBand`/`d3.scaleLinear` for axes, with a color-coded scheme (`d3.schemePaired`) distinguishing years. Hovering over individual bar segments reveals a tooltip with detailed sales data, while clicking a segment dims the rest of the chart.
AI-generated descriptionMIT Licensed




Comments
Sign in to join the discussion.