🌍 Public
Stacked Bar Chart with HTML
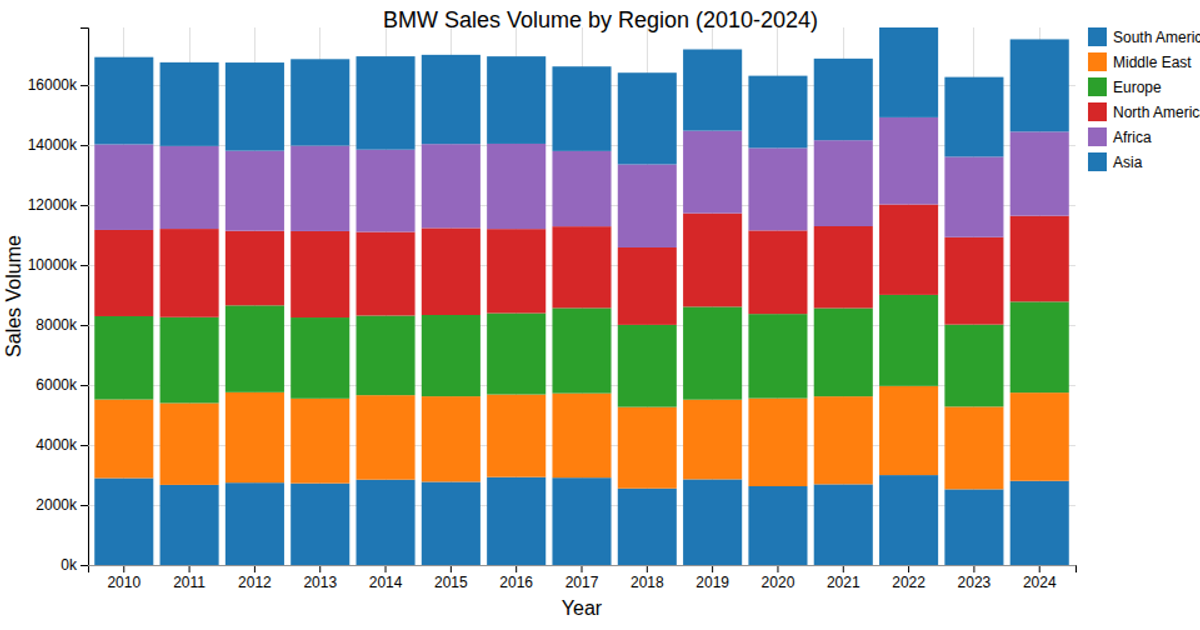
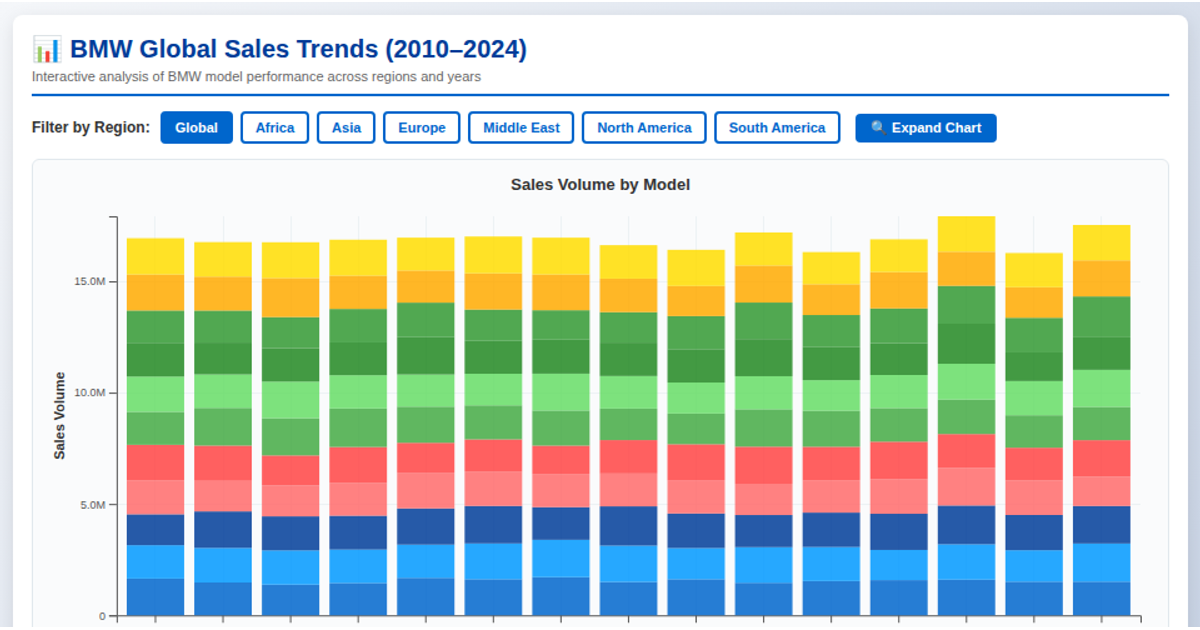
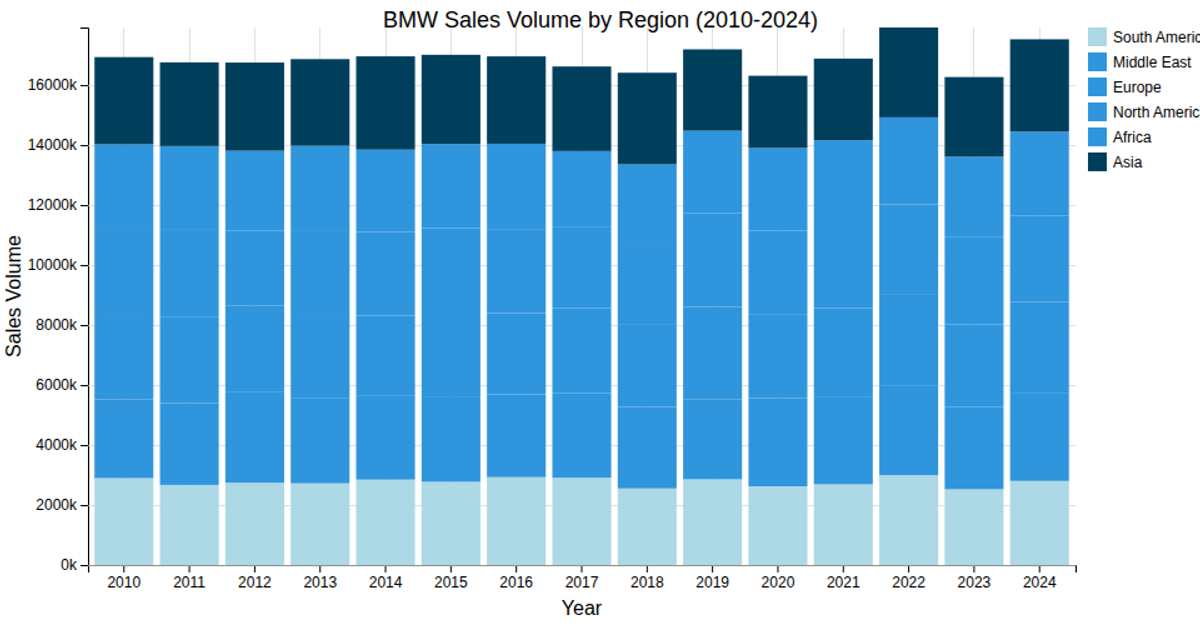
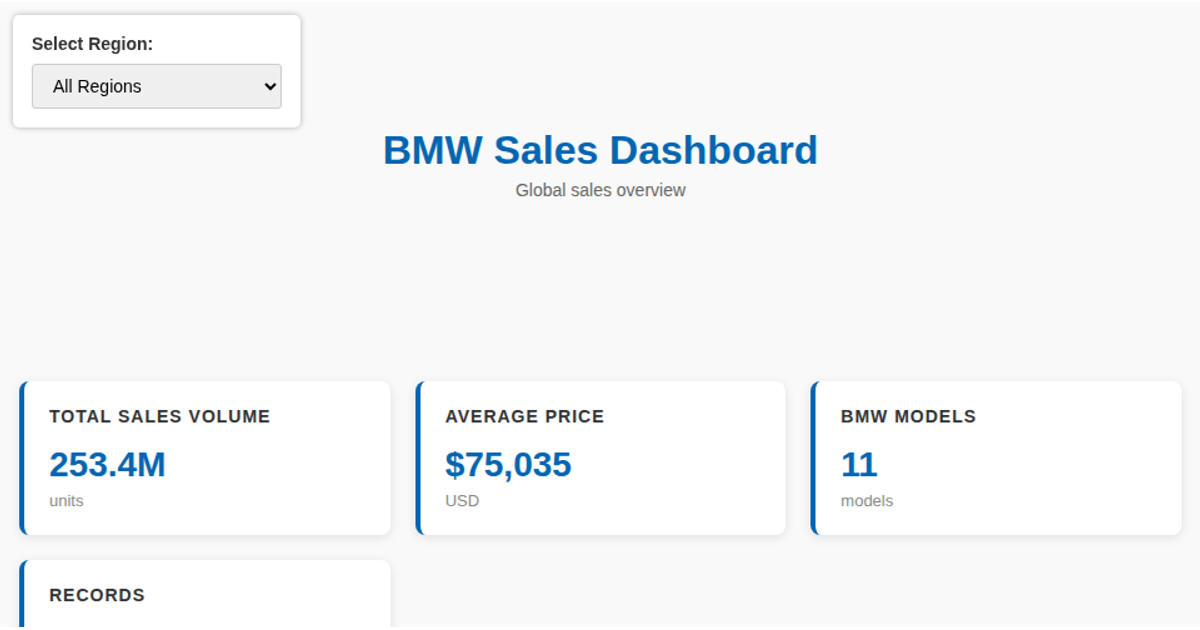
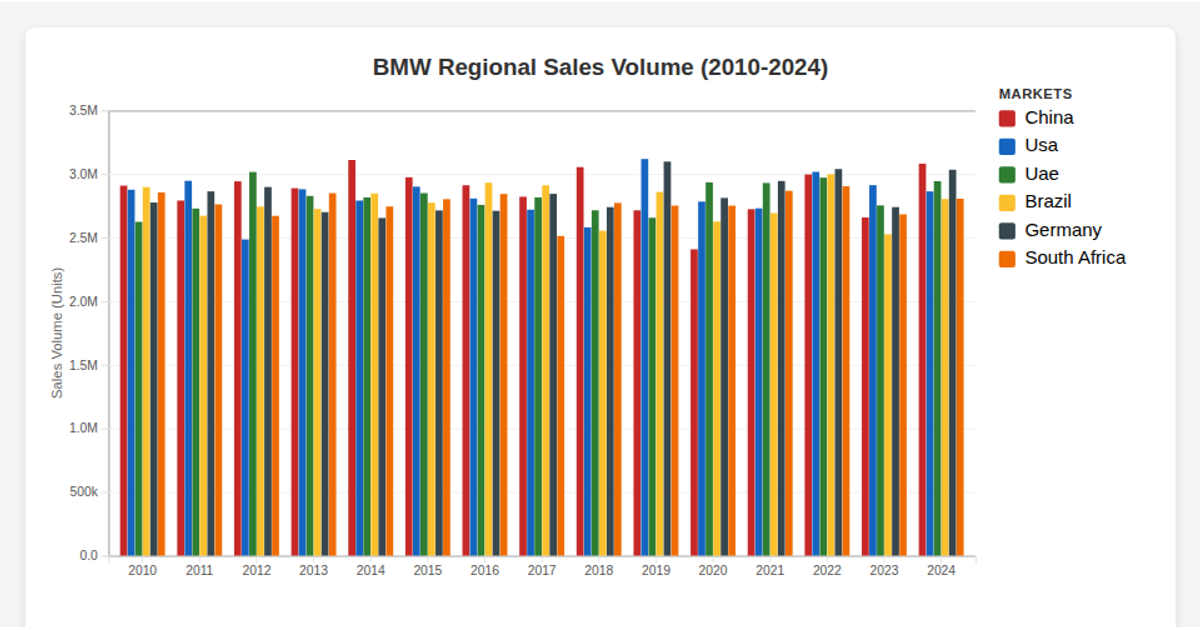
This stacked bar chart displays BMW sales volume by region across years from 2010 to 2024, using aggregated data from a CSV file. The visualization uses D3 v7’s `d3.rollups`, `d3.stack`, and `d3.scaleBand` to group and stack regional sales contributions per year into a single SVG. Color-coded segments represent five regions, with axes, grid lines, and a legend generated via `d3.axisBottom`, `d3.axisLeft`, and ordinal color scaling. Sales values are aggregated with `d3.sum` and formatted in thousands on the y-axis.
AI-generated descriptionMIT Licensed


Comments
Sign in to join the discussion.