🌍 Public
Fork of Fork of Fork of Vikas Fork of Fork of Fork of Fork of HTML Starter
Ppanduvik99@gmail.com
Last edited Mar 5, 2024
Created on Mar 5, 2024
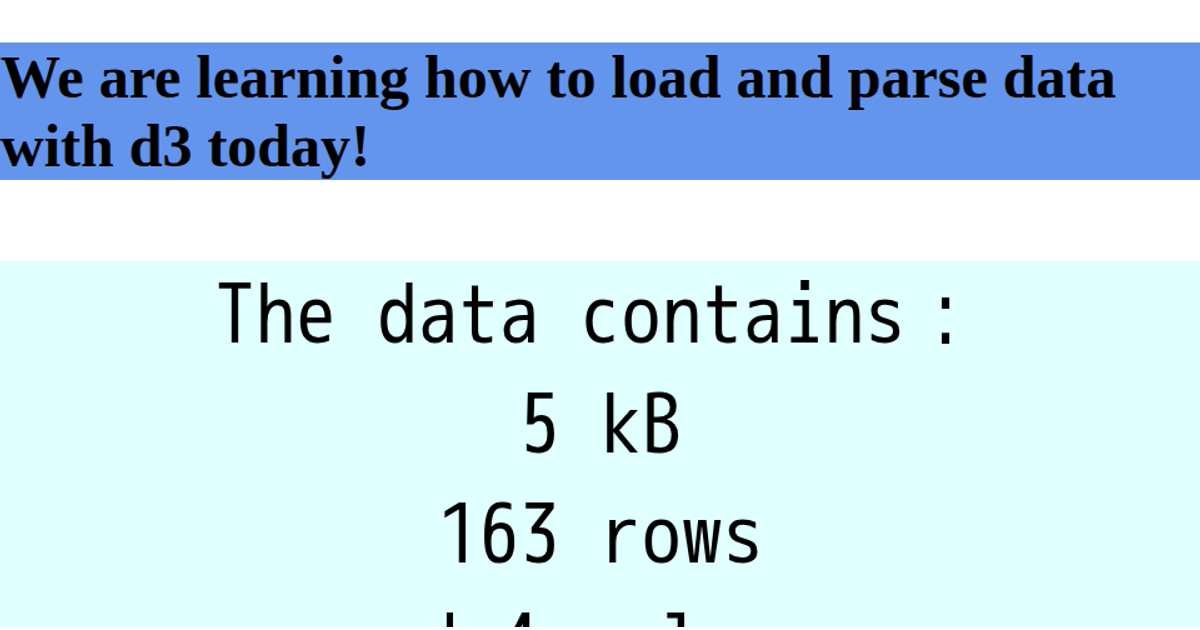
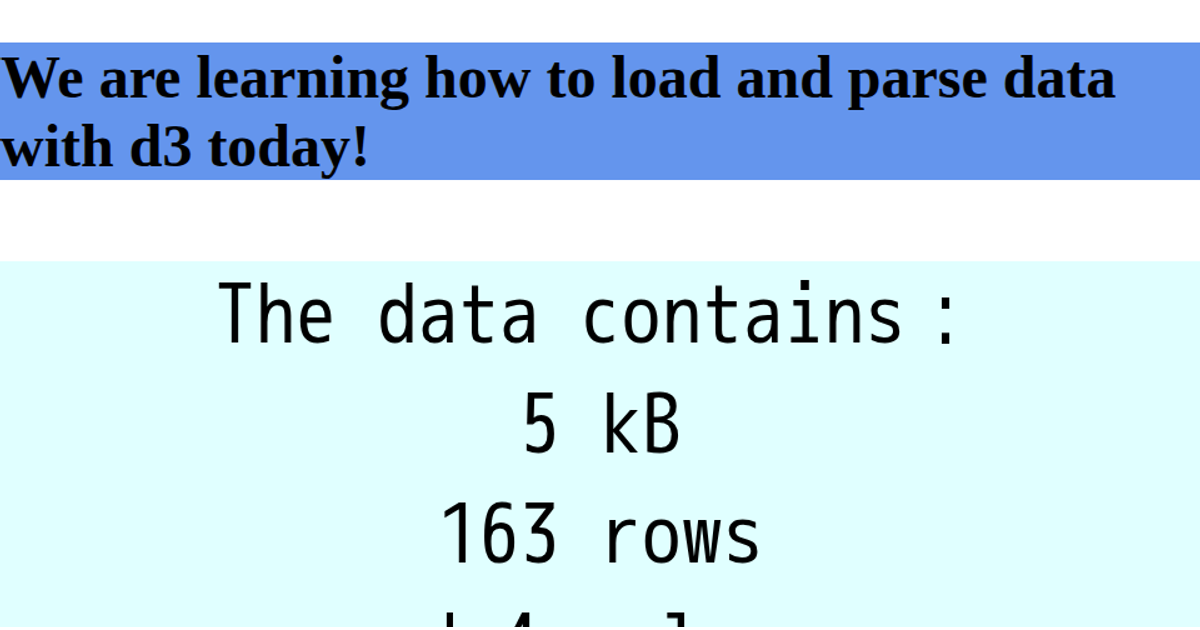
This example demonstrates a scientific data visualization of the ICE-5 dataset, showing summary statistics about the data's size and structure in a text container. It also includes an embedded SVG image and a custom color legend rendered as four simple car graphics, each labeled with a specific color name. The visualization uses D3.js v7 to load and parse a remote CSV file via `d3.csv`, then displays the number of rows, columns, and file size in kilobytes. The SVG elements are drawn manually with basic shapes like `rect` and `circle` to illustrate the color palette.
AI-generated descriptionA bare minimum HTML page demonstrating use of CSS and JavaScript.
See also React Starter.
MIT Licensed




Comments
Sign in to join the discussion.