🌍 Public
Fork of Fork of Fork of HTML Starter
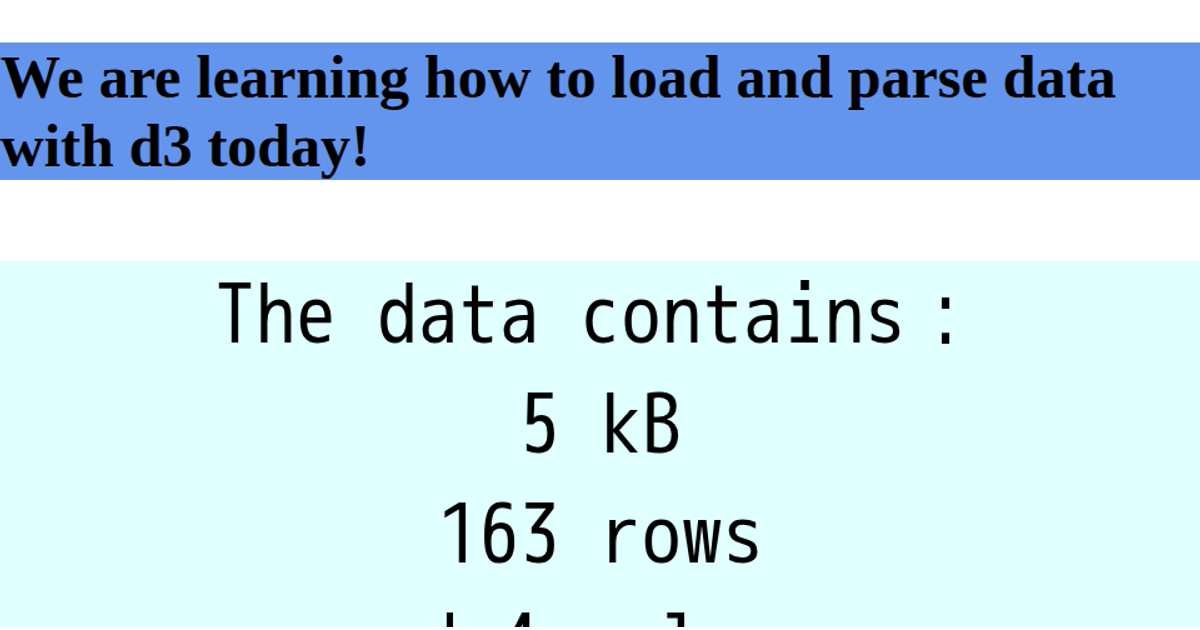
This example displays a static welcome page for ICE-5 data visualization, featuring a title, an embedded SVG image, and a text summary of a loaded CSV dataset. The page uses d3.csv to fetch and parse the remote CSV file, then computes and displays the dataset’s size in kilobytes, row count, and column count. D3 v7 is loaded via unpkg, and the summary updates dynamically in a <pre> element. The visualization does not include charts or interactive graphics; it focuses on presenting metadata about the CSV source.
AI-generated descriptionA bare minimum HTML page demonstrating use of CSS and JavaScript.
See also React Starter.
MIT Licensed



Comments
Sign in to join the discussion.