🌍 Public
Rhododendrons.js!
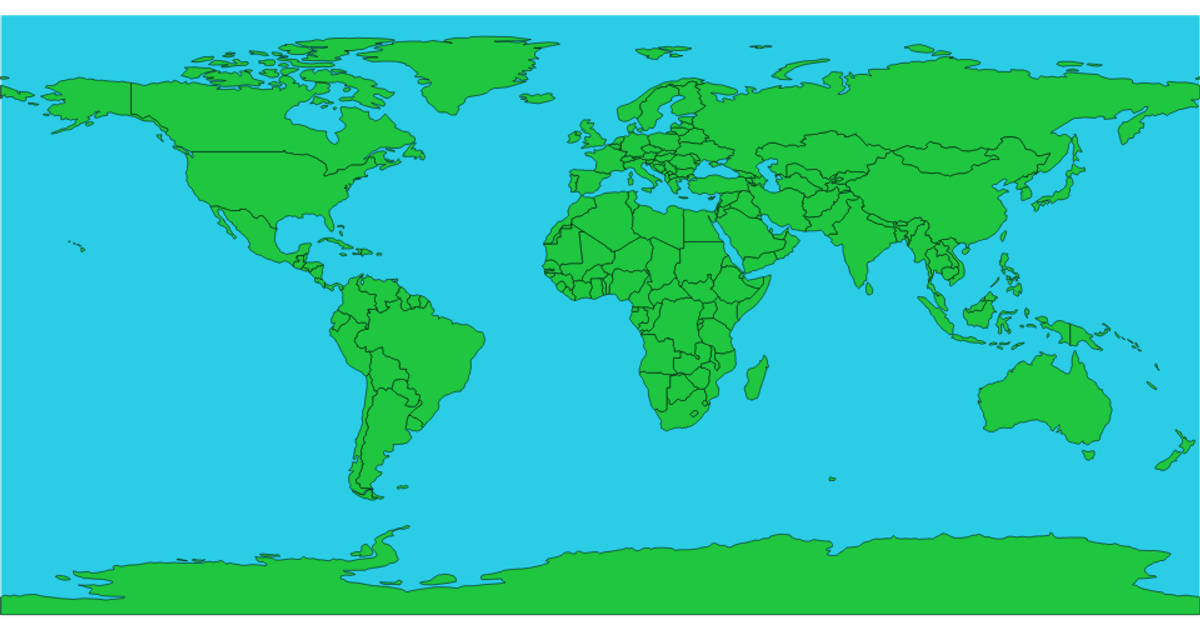
This map visualizes rhododendron species counts across TDWG level three regions using a Winkel triple projection. Countries are filled with a categorical color scale derived from species-count categories, and hovering over a region reveals its name and exact species count via an SVG title tooltip. The code uses d3.geoPath, geoWinkel3, and topojson features, with zoom support via d3.zoom. A custom colourLegend component renders the ordinal color legend using schemePastel1, while data is loaded from a TSV file containing Level3 codes and counts.
AI-generated descriptionTDWG level three regions with species counts. Alberta is missing from the JSON - Fixed
MIT Licensed




Comments
Sign in to join the discussion.