🌍 Public
Project | Load color | legend | moving
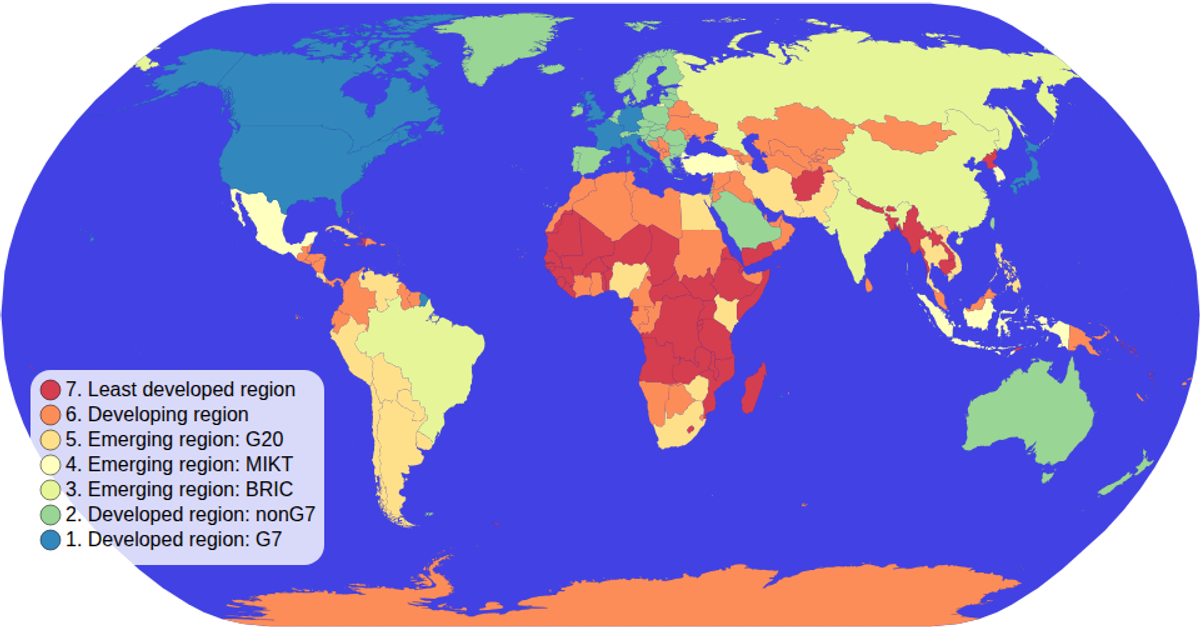
This example displays a world map with countries colored by a categorical measure of "prudence," using a yellow-or-red ordinal color scale. An interactive legend allows users to click a color value to filter and highlight matching countries while dimming others. The visualization uses d3.geoPath with a geoEquirectangular projection, d3.zoom for panning, and a custom color legend component. Data comes from CSV and TopoJSON files, rendered as SVG paths with hover effects defined in CSS.
AI-generated descriptionMIT Licensed


Comments
Sign in to join the discussion.