🌍 Public
Interesting Knowledge
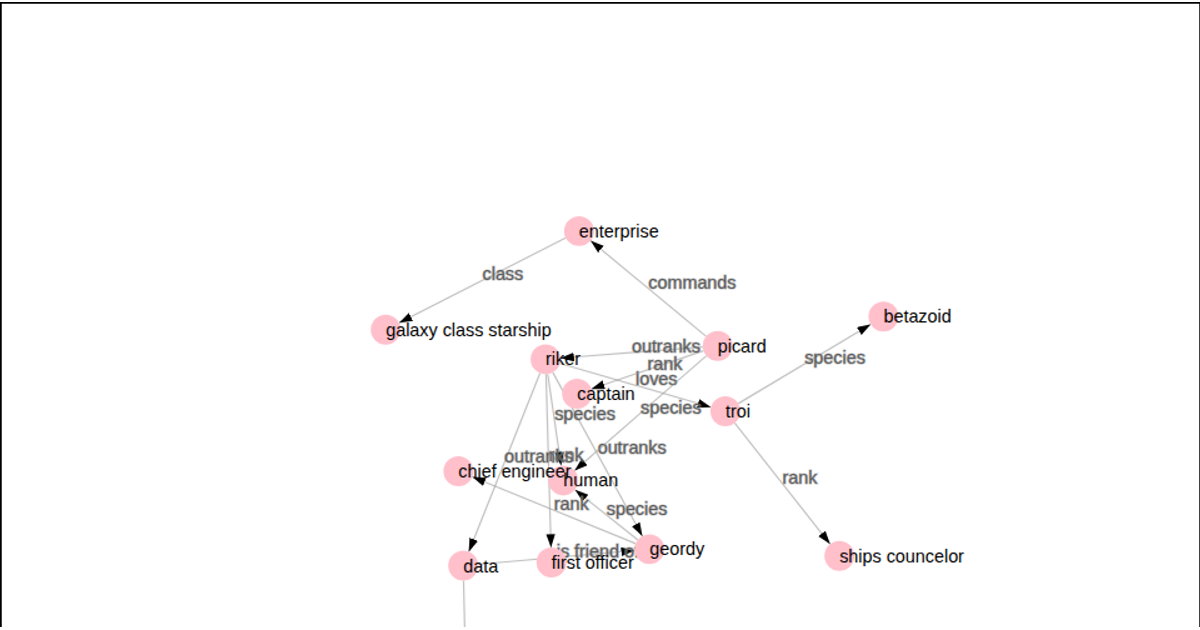
This example shows a force-directed network graph of character relationships from Star Trek: The Next Generation, with labeled edges for actions like "commands", "outranks", and "species." The visualization uses d3.forceSimulation to position nodes and links, with SVG lines and text for edges and labels, plus draggable circles for nodes. Arrow markers indicate directed connections, and the layout adjusts dynamically as the simulation runs.
AI-generated descriptionMIT Licensed




Comments
Sign in to join the discussion.