🌍 Public
My Knowledge Graph2
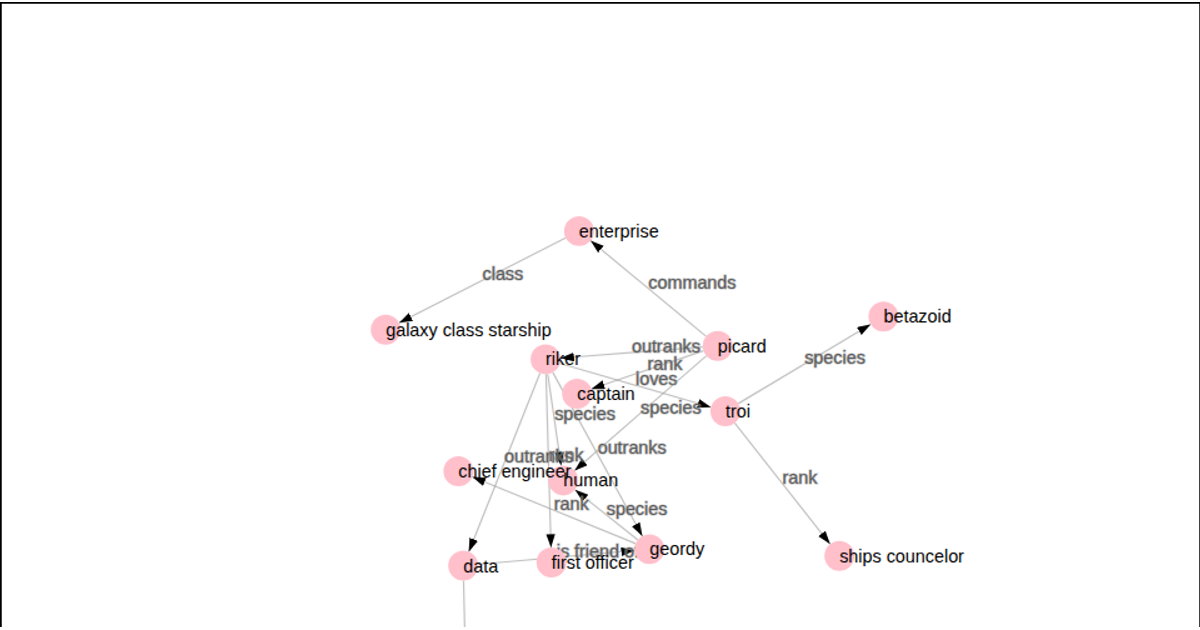
This interactive network visualization maps the command hierarchy and relationships among characters from Star Trek: The Next Generation. Using D3.js force-directed layout via `d3.forceSimulation`, `d3.forceLink`, and `d3.forceManyBody`, it renders an SVG graph of nodes and labeled directed edges from a hardcoded triple array. Users can drag nodes, with edges and labels updating continuously throughout the simulation. The code builds the graph using D3's data join operators, `Immutable.Set` for deduplication, and custom arrow markers to indicate relationship direction.
AI-generated descriptionMIT Licensed


Comments
Sign in to join the discussion.