🌍 Public
Rebrickable Lego Sets by Year
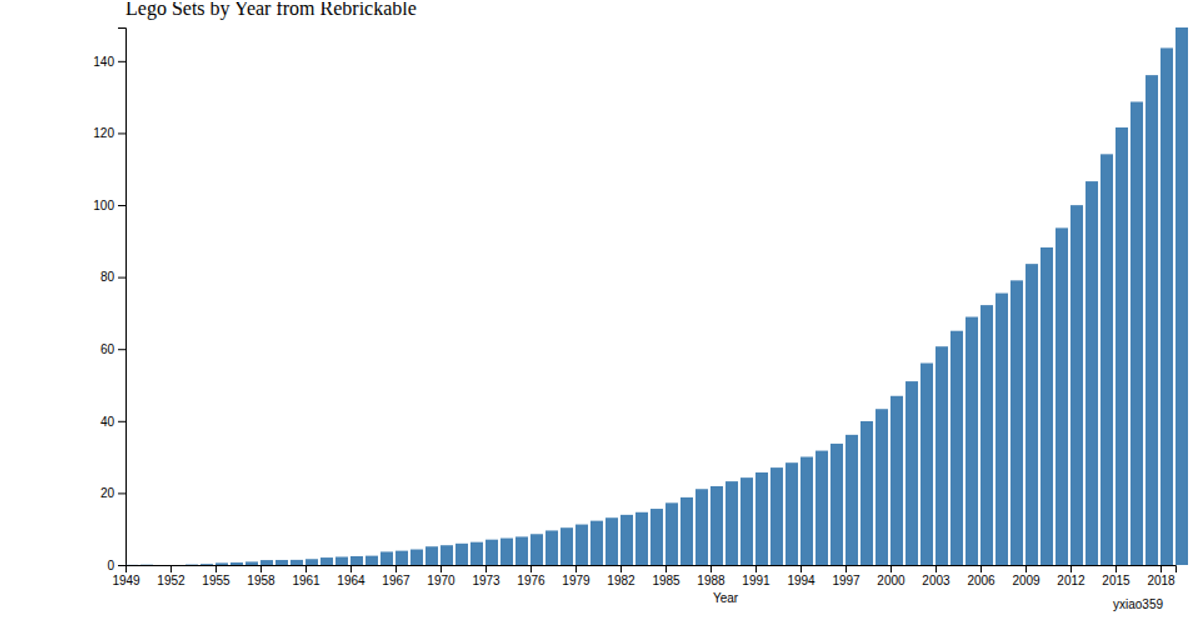
This bar chart shows the cumulative total of Rebrickable Lego sets released each year from 1949 to 2019, using a time-based scale with rectangular bars. The data, loaded from a CSV file, is rendered as SVG rectangles with a blue fill, positioned using `d3.scaleTime` and `d3.scaleLinear`, and axes are generated with `d3.axisLeft` and `d3.axisBottom`. The chart includes a title and an author attribution, with the bars scaled and inverted via SVG transforms.
AI-generated descriptionThis bar chart comes from (https://beta.vizhub.com/curran/c3b14112dae34ef395999cef5783324f).
MIT Licensed


Comments
Sign in to join the discussion.