🌍 Public
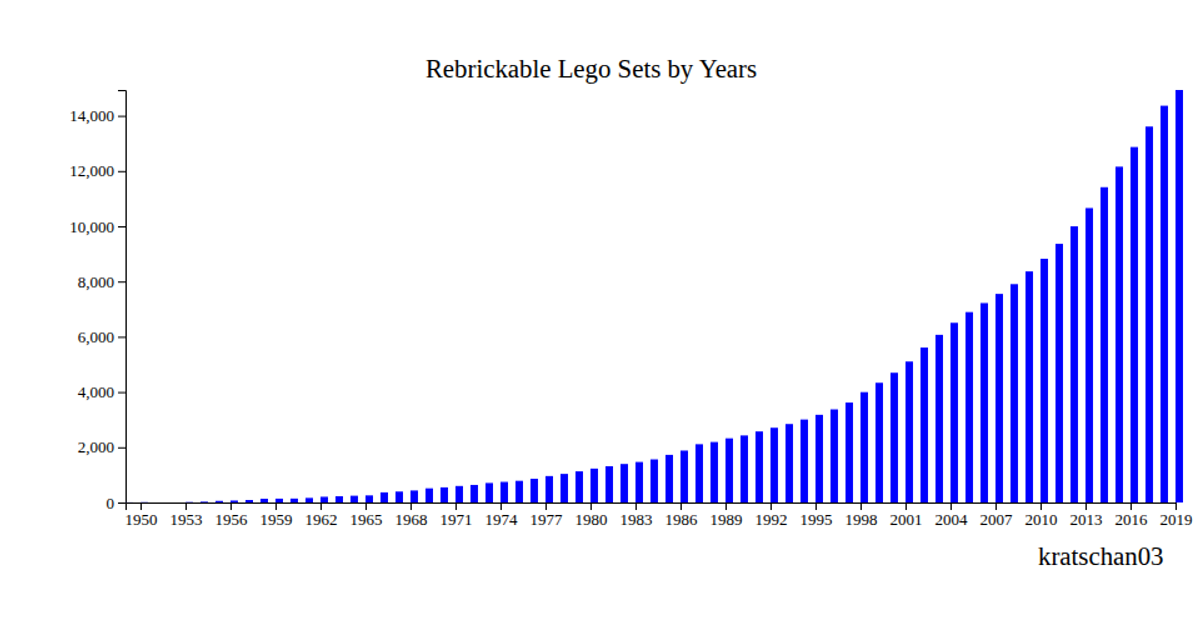
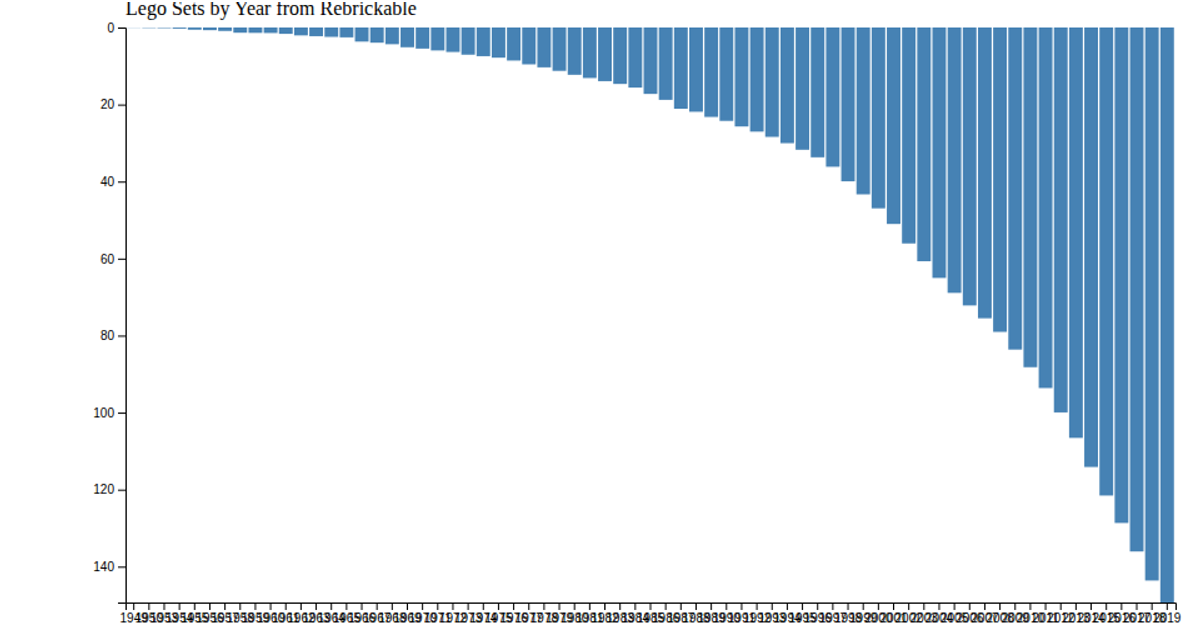
Rebrickable Lego Sets by Year
This bar chart shows the cumulative number of Rebrickable Lego sets released each year from 1949 to 2019, with the running total rising steadily from 5 to nearly 15,000. The visualization uses D3 v5’s `scaleTime` for the x-axis (with ticks every three years) and `scaleLinear` for the y-axis, rendering steelblue rectangles via SVG. Data is loaded from a CSV using `dsv`, and the chart includes a title and author credit.
AI-generated descriptionThis bar chart comes from (https://beta.vizhub.com/curran/c3b14112dae34ef395999cef5783324f).
MIT Licensed



Comments
Sign in to join the discussion.