🌍 Public
Yaswanth_ICE_8
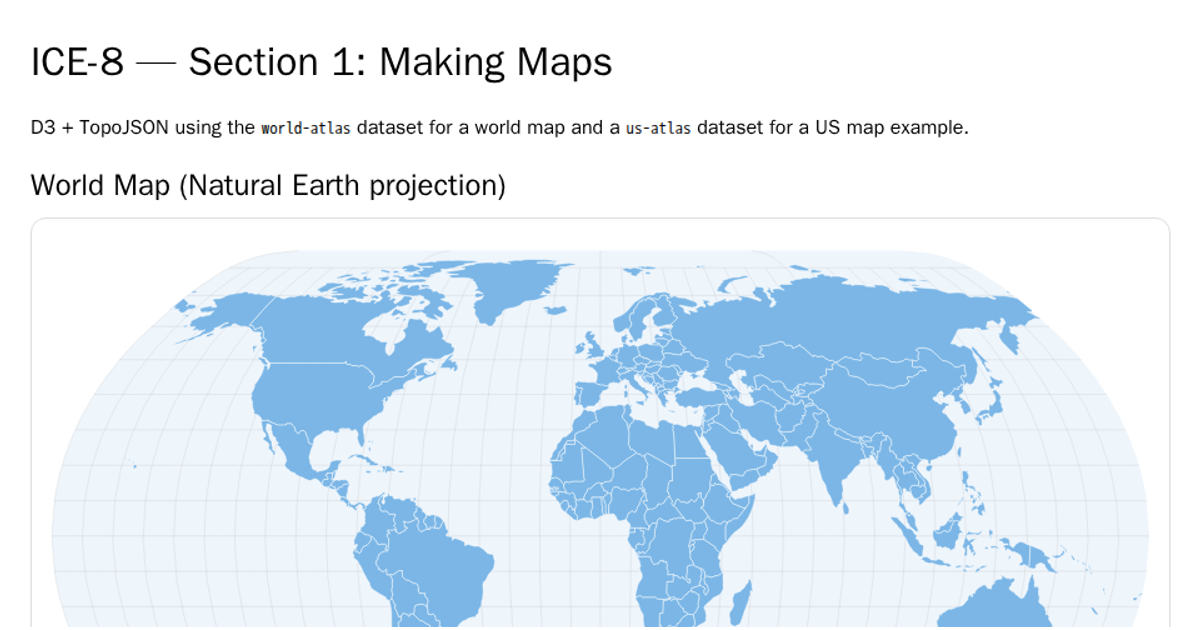
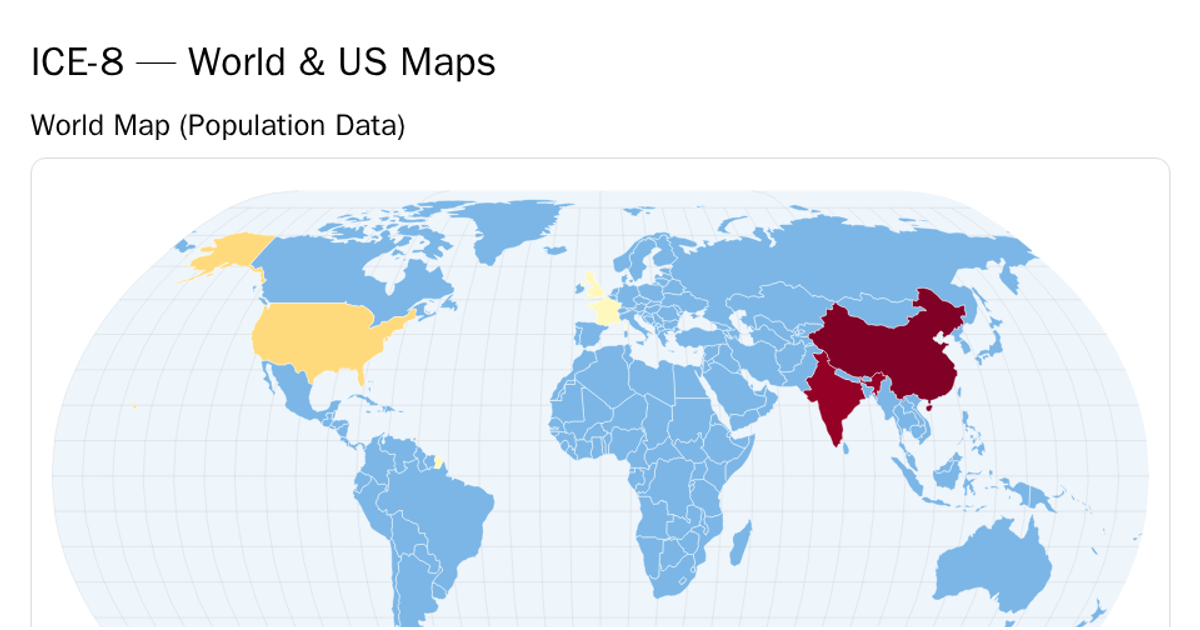
This example presents two linked SVG maps of the world showing the geographic distribution of the largest lawsuits (in USD billions). A choropleth map displays all countries by settlement value, while a second map highlights the top N countries and dims the rest, with an interactive number input to adjust N. The visualization uses D3 v7 with `d3.geoPath` and TopoJSON from the world-atlas dataset. Hovering over countries reveals a tooltip, and highlighted countries are summarized as pills beneath the maps.
AI-generated descriptionMIT Licensed





Comments
Sign in to join the discussion.