🌍 Public
ICE_8_maps
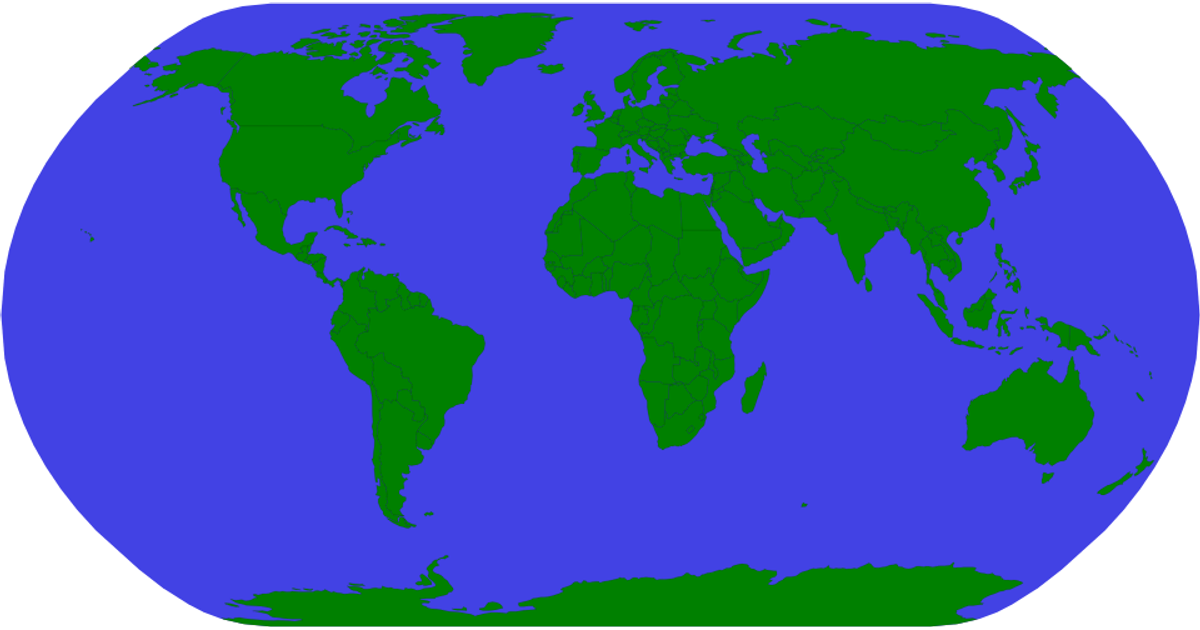
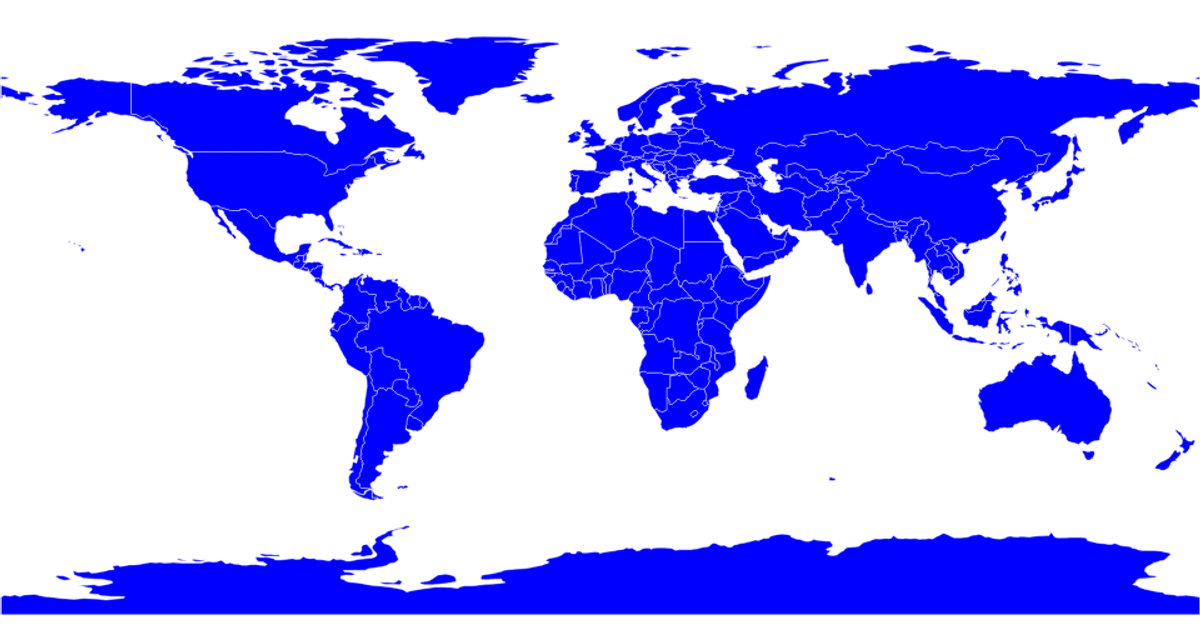
This example presents a basic world map rendered as an SVG using D3.js version 7 and the TopoJSON client library. The visualization displays country borders as geographic paths, created with the `d3.geoPath` projection from TopoJSON data loaded via `topojson-client`. The interface shows a single titled view inside a chart container, highlighting a straightforward representation of global landmasses without additional interaction or data layers. The code relies on D3’s map projection utilities to translate geographical coordinates into the 960×520 viewBox.
AI-generated descriptionMIT Licensed




Comments
Sign in to join the discussion.