🌍 Public
ICE8 - World Map
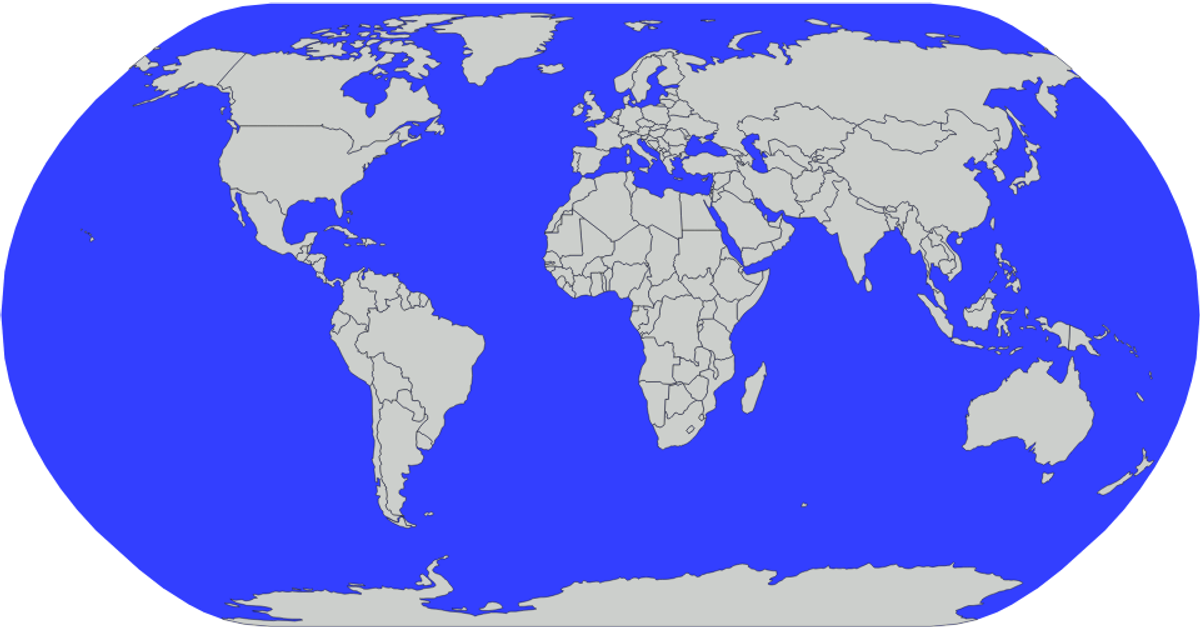
This example renders a static world map using D3.js version 5 and TopoJSON. It displays all countries from the world-atlas dataset as purple SVG paths with black outlines, overlaid on a light blue sphere representing the globe. The visualization uses `d3.geoNaturalEarth1` for projection and `d3.geoPath` to generate the geographic paths, while the TopoJSON `feature` API converts the source data into GeoJSON for rendering.
AI-generated descriptionA demonstration of ICE-8 how to Create a world map with the world Topojson data.
MIT Licensed




Comments
Sign in to join the discussion.