🌍 Public
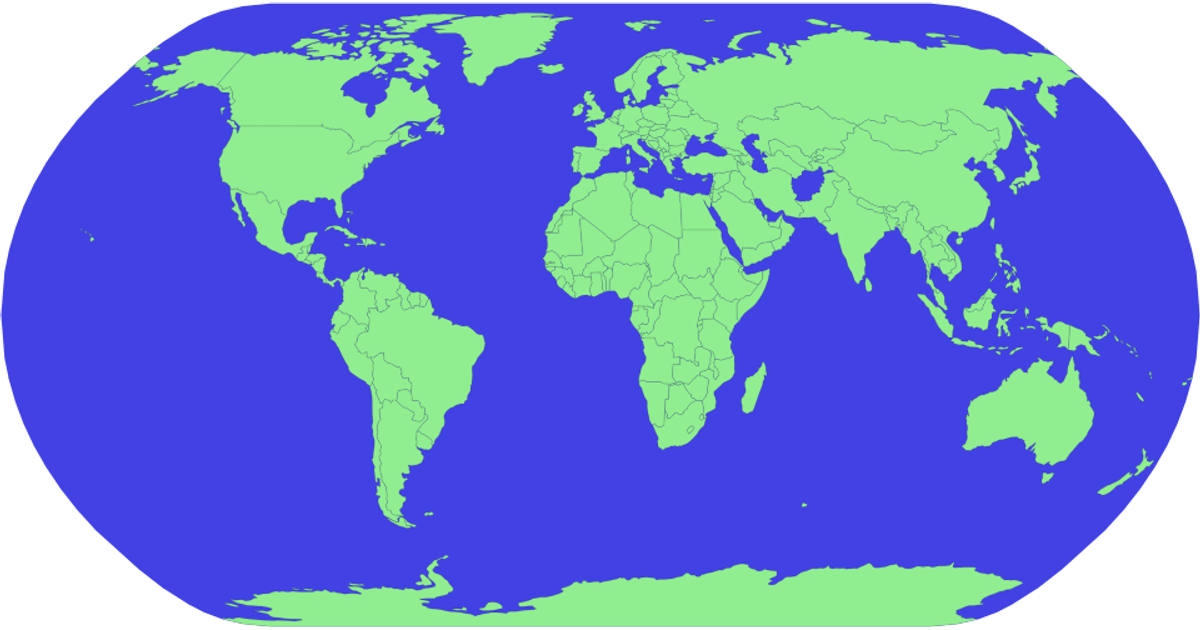
Let's make a map with D3.js!
This example displays a world map using a blue sphere background and light green country polygons, with a thin black stroke outlining each nation. It loads geographic boundaries from the World Atlas TopoJSON dataset and renders them as SVG paths via `d3.geoPath` with the `d3.geoAlbersUsa` projection. The code uses `topojson.feature` to convert TopoJSON geometry into GeoJSON features. A video link in the README suggests the visualization accompanies a tutorial on creating maps with D3.
AI-generated descriptionMIT Licensed



Comments
Sign in to join the discussion.