🌍 Public
Let's make a map with D3.js!
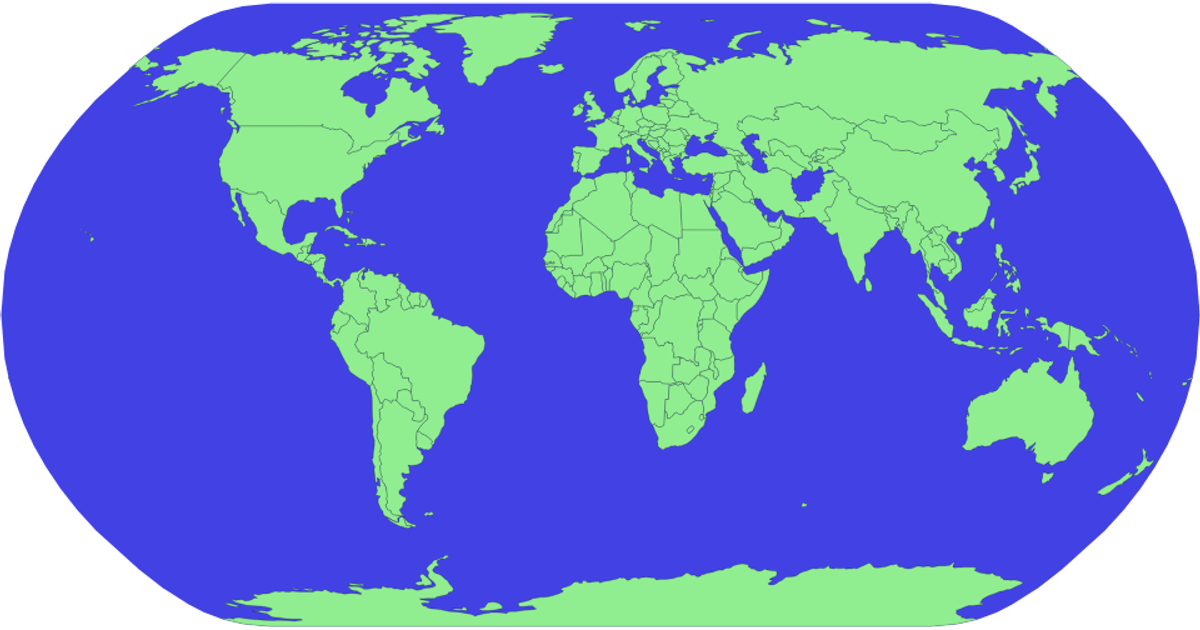
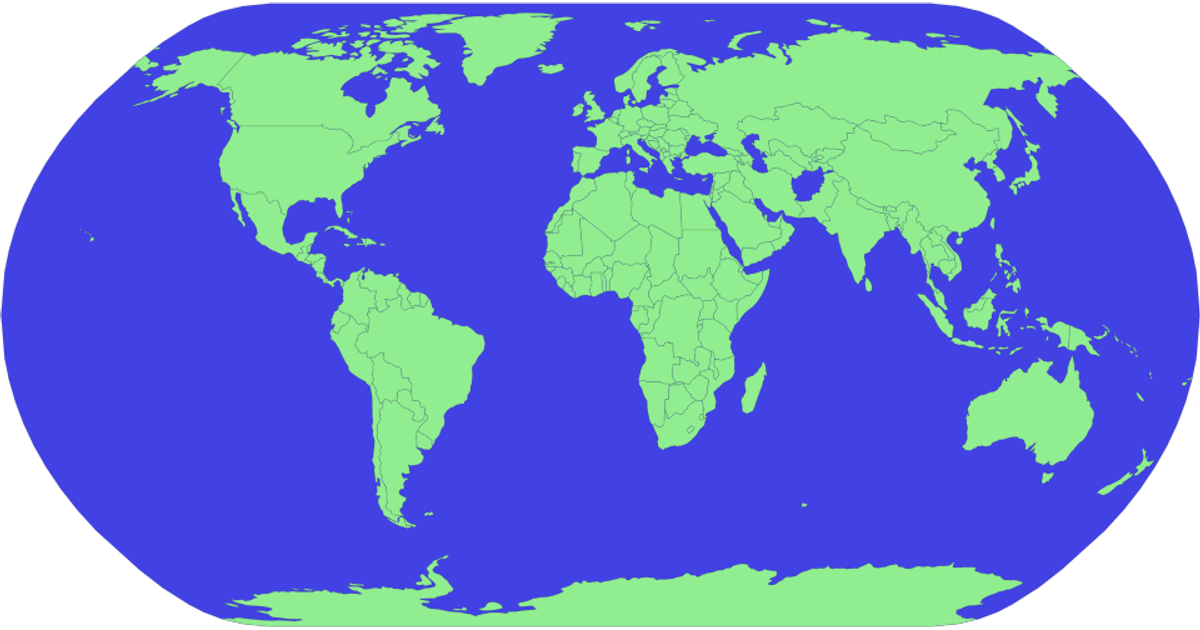
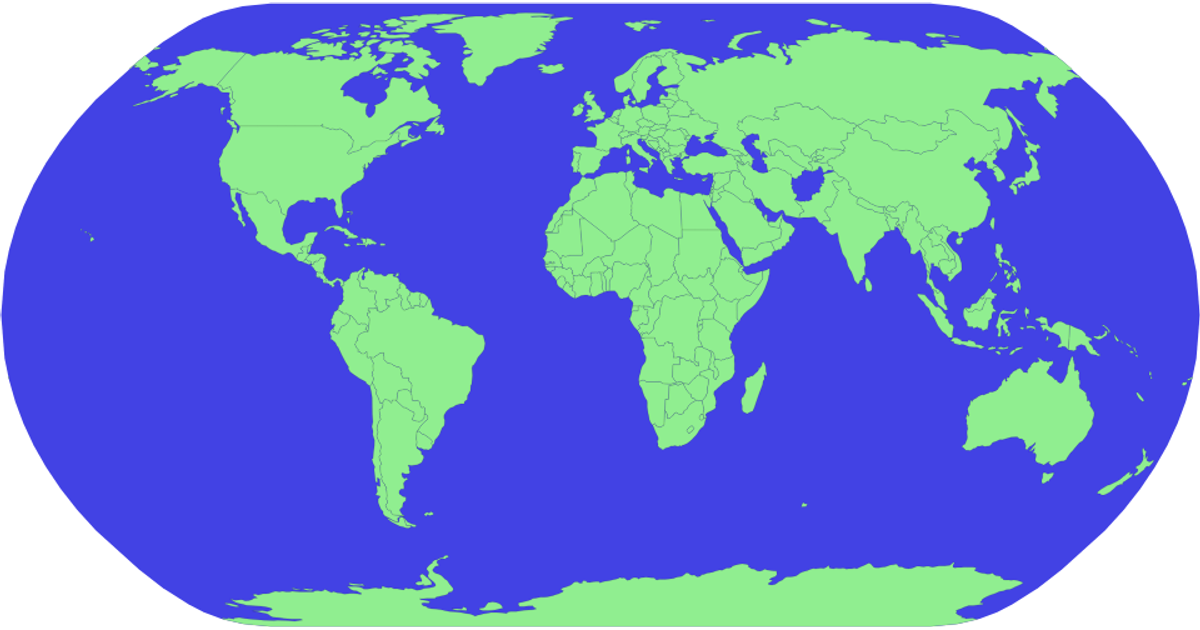
This example shows a world map rendered with a blue sphere background and light green country outlines using an SVG canvas. It loads geographic data from the world-atlas TopoJSON file and converts it to GeoJSON via topojson.feature. The map uses d3.geoNaturalEarth1 for projection and d3.geoPath to generate the SVG paths, with d3.json fetching the remote dataset. The page includes a linked YouTube tutorial video and applies simple CSS styling for the sphere and country fills.
AI-generated descriptionMIT Licensed



Comments
Sign in to join the discussion.