🌍 Public
Scatter Plot With Meun
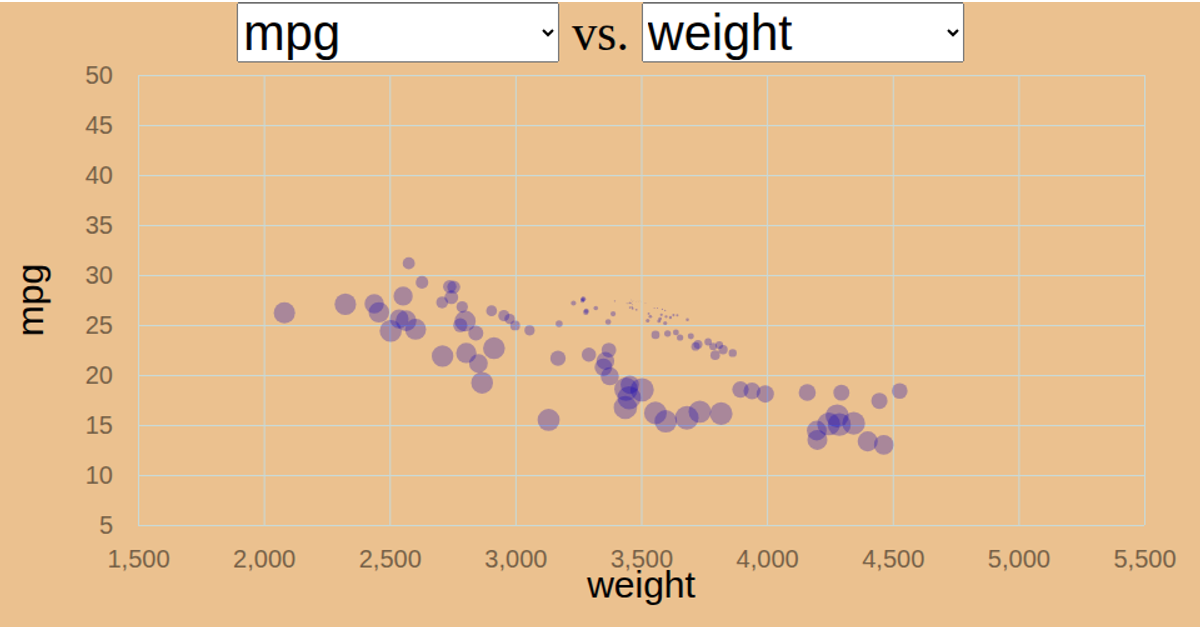
This interactive scatter plot visualizes relationships between car performance attributes like horsepower, weight, and acceleration using an animated D3.js SVG. Users select different columns from dropdown menus to dynamically update the x- and y-axes, with the plot transitioning smoothly (via `.transition().delay()`) as circles reposition. The visualization uses D3's `scaleLinear`, `axisBottom`, and `axisLeft` to render axes and grids, processing data from a local CSV file.
AI-generated descriptionMIT Licensed







Comments
Sign in to join the discussion.