Fork of Scatter Plot with Menus
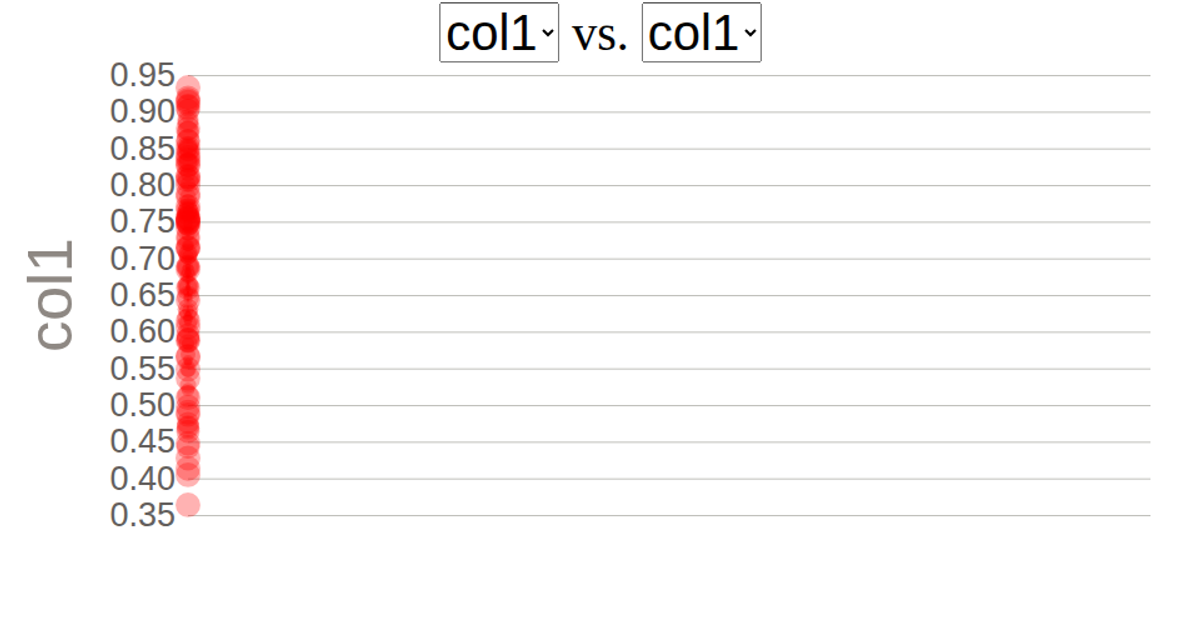
This scatter plot visualizes car data from the UCI Machine Learning Repository's Auto MPG data set, displaying relationships between attributes such as horsepower, weight, and acceleration. Users select which columns map to the X and Y axes via dropdown menus, triggering a re-render of the visualization. The plot uses d3's `csv`, `scaleLinear`, `extent`, `axisLeft`, `axisBottom`, and a custom `scatterPlot` module with animated transitions via `transition().duration(2000)`. SVG circles represent individual cars, with axes and labels rendered using d3's `axisBottom` and `axisLeft` APIs.
AI-generated descriptionThis scatter plot shows data about cars, from UCI Machine Learning Repository: Auto MPG Data Set. The user can select which columns map to X and Y using dropdown menus.




Comments
Sign in to join the discussion.