🌍 Public
Twitter - Line Chart ICE-7
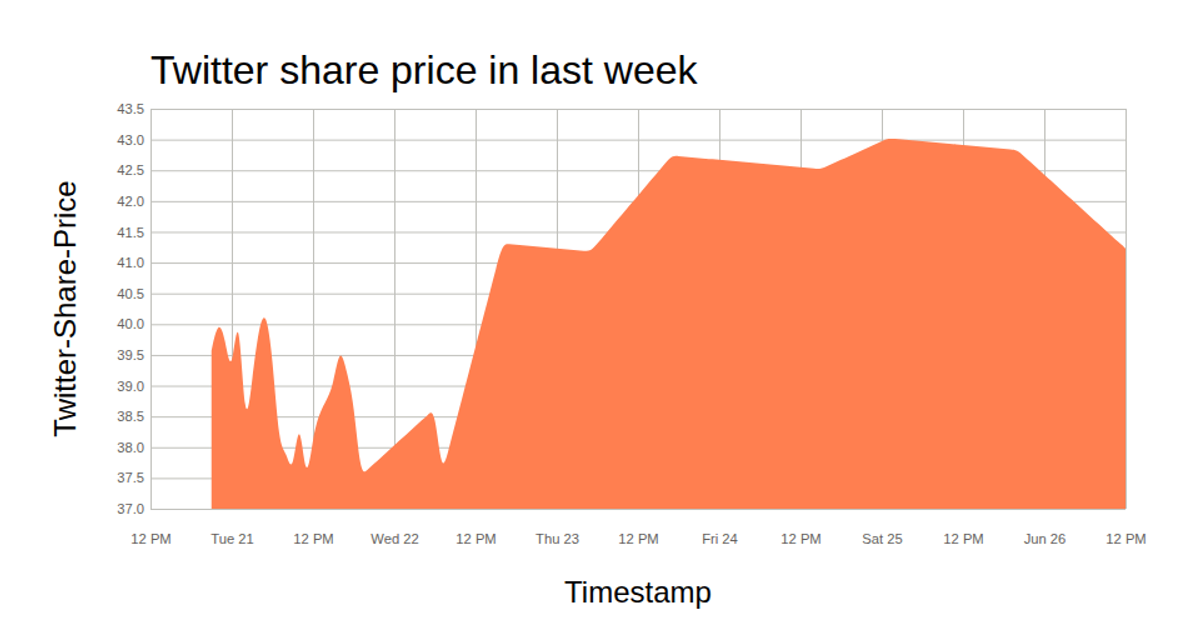
This line chart displays Twitter stock prices over the last week, plotting timestamps on the x-axis and share values on the y-axis. The visualization uses D3 v5 with React, rendering to an SVG via the `line` generator with `curveBasis` smoothing. Axes are constructed using `scaleTime`, `scaleLinear`, `axisBottom`, and `axisLeft`, with grid lines and labels styled via CSS. Data is loaded from a CSV file hosted on GitHub, parsed with `csv`, and converted to numeric and date formats before rendering.
AI-generated descriptionA bare minimum HTML page demonstrating use of CSS and JavaScript.
See also React Starter.
MIT Licensed



Comments
Sign in to join the discussion.