🌍 Public
Twitter - Area Chart ICE-7
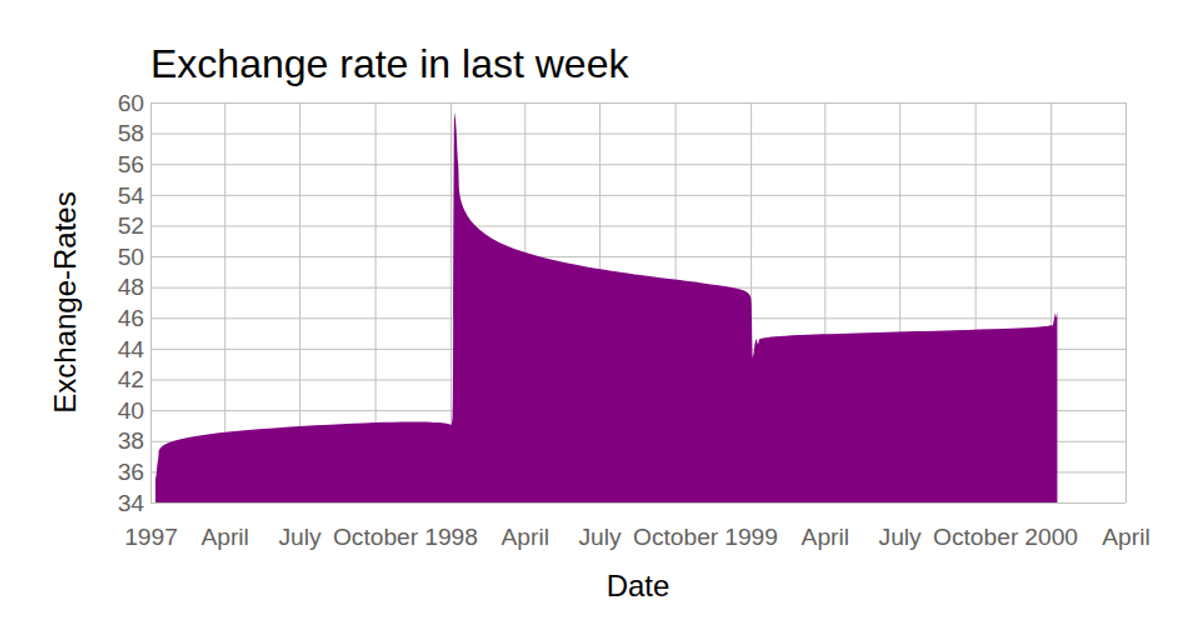
This visualization displays Twitter share prices over the past week using a smooth area chart. The chart plots timestamps on the x-axis and share price on the y-axis, with axis labels and a title. Created with React and D3 v5, the code uses `d3.select`, `d3.csv`, `d3.scaleTime`, `d3.scaleLinear`, `d3.axisBottom`, `d3.axisLeft`, and the `d3.area` generator with `curveBasis` to render the filled curve as an SVG path. Data is loaded from a GitHub gist CSV file.
AI-generated descriptionA bare minimum HTML page demonstrating use of CSS and JavaScript.
See also React Starter.
MIT Licensed




Comments
Sign in to join the discussion.