Fork of Cost of Living Vs Purchasing Power
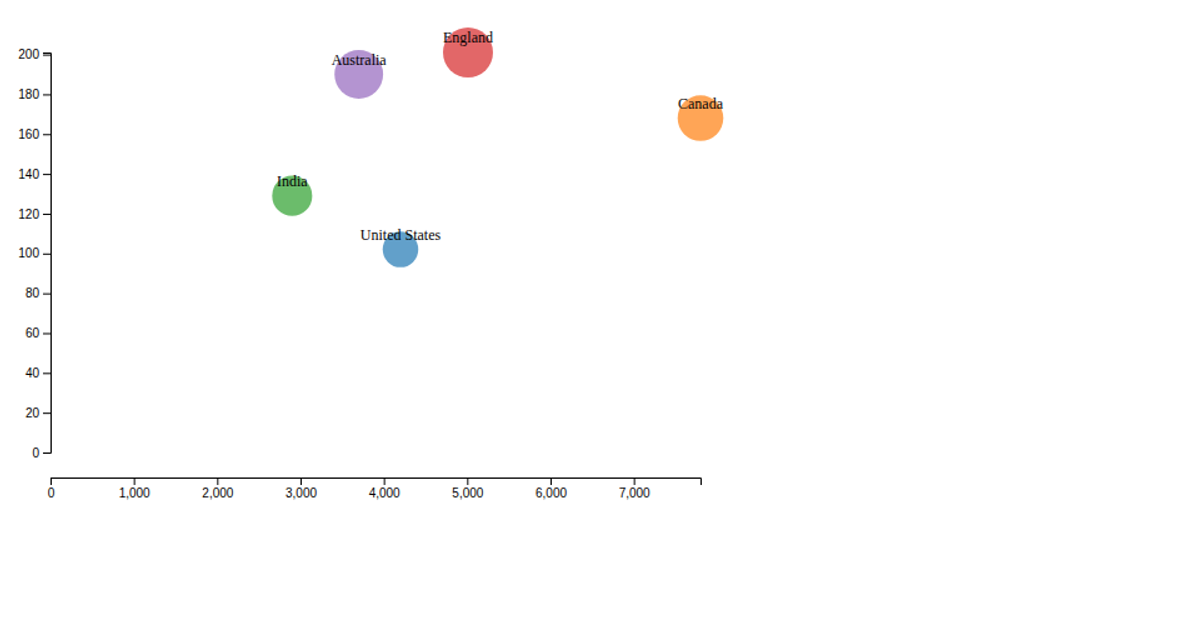
This interactive scatter plot maps 115 countries by cost of living (x-axis) against local purchasing power (y-axis). Circle size reflects global rank, while color encodes the purchasing-power-to-cost ratio, from green ("Excellent") to red ("Poor"). A dashed diagonal line marks equal ratios, with quadrant labels for context. Built with React, D3.js (v7) `scaleLinear` and `axisBottom`, the visualization supports hover tooltips, click-to-select country highlighting, and a clear-selection control. Data comes from a bundled `data.csv` file.
AI-generated descriptionGlobal Cost of Living vs Purchasing Power Analysis
An interactive data visualization showing the relationship between cost of living and local purchasing power across different countries.
Features
- Interactive Scatter Plot: Explore data points by hovering and clicking
- Color-coded Value Ratings: Countries are colored based on their purchasing power to cost of living ratio
- Enhanced Tooltips: Detailed information on hover with formatted data
- Selection State: Click to select/deselect countries for comparison
- Trend Analysis: Diagonal reference line shows equal cost-to-power ratio
- Responsive Design: Adapts to different screen sizes
Understanding the Visualization
- X-axis: Cost of Living Index (higher = more expensive)
- Y-axis: Local Purchasing Power Index (higher = better purchasing power)
- Colors:
- Green: Excellent value (purchasing power >1.5x cost of living)
- Blue: Good value (1.0-1.5x ratio)
- Orange: Fair value (0.7-1.0x ratio)
- Red: Poor value (<0.7x ratio)
- Size: Larger circles indicate higher global rankings
Technology Stack
- React for component structure and state management
- D3.js for data visualization and DOM manipulation
- Modern CSS with custom properties and gradients
- ES6 Modules for clean code organization
Data Source
Cost of living data including rent, groceries, restaurant prices, and local purchasing power indices for countries worldwide.


Comments
Sign in to join the discussion.