🌍 Public
D3
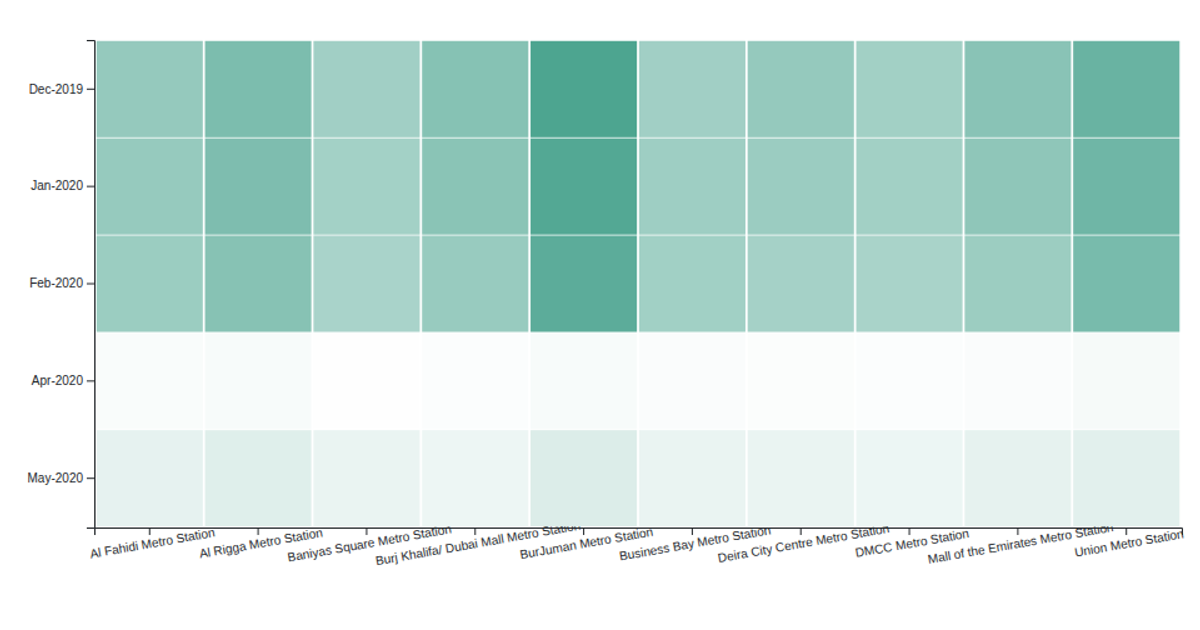
The visualization is a heat map showing monthly trip counts for Dubai Metro stations, displaying the top ten stations by total trips across the available months. Station names appear on the x-axis while month-year combinations form the y-axis, with color intensity representing trip volume. Built with D3 v5, the code aggregates trip data from a CSV file, then renders colored SVG rectangles that scale from white to green. Interactive tooltips appear on hover, showing the exact trip count for each station-month pair.
AI-generated descriptionTop 10 stations by month heat map
- Heat map to show monthly activities by trip count on stations
MIT Licensed




Comments
Sign in to join the discussion.