🌍 Public
D3
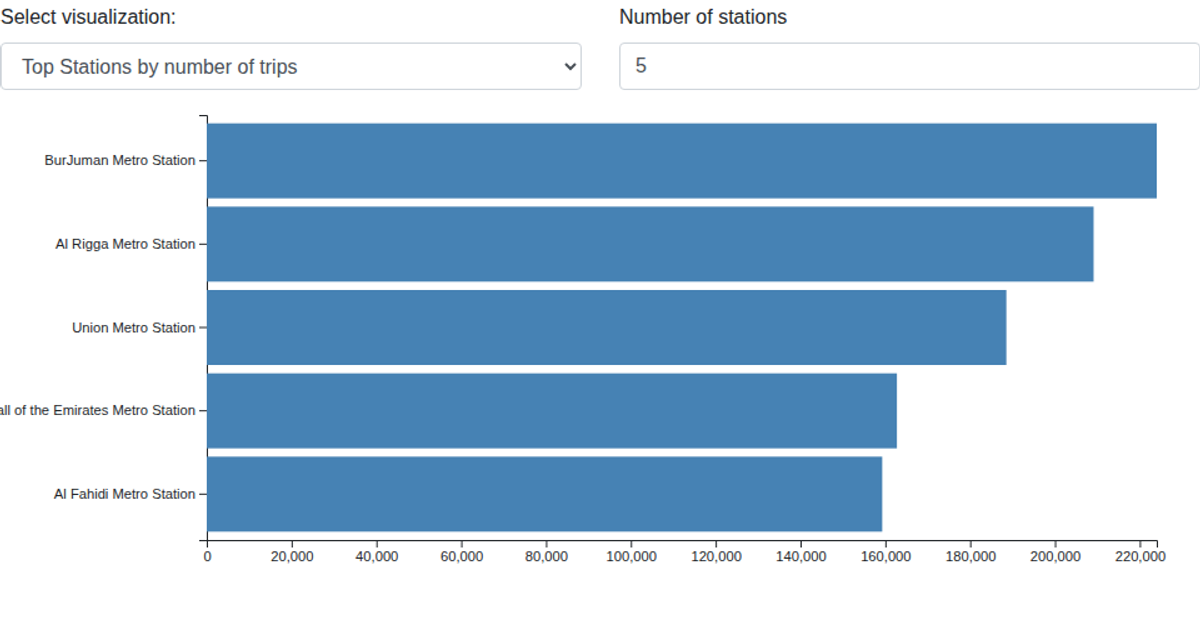
This heat map visualizes the top 10 metro stations in Dubai by total trip counts, with monthly activity shown across a grid of colored cells. The data is filtered from a CSV file containing station, month, and trip records, then aggregated to rank stations. Rendered as an SVG using D3 v5, the visualization employs `d3.scaleBand` for axes, `d3.scaleLinear` for color encoding, and interactive tooltips on hover to display specific trip numbers.
AI-generated descriptionTop 10 stations by month heat map
- Heat map to show monthly activities by trip count on stations
MIT Licensed




Comments
Sign in to join the discussion.