🌍 Public
Salem Map points
Vvigneswaran009
Last edited May 19, 2021
Created on May 19, 2021
Forked from Fork of Fork of Salem map class added-extract
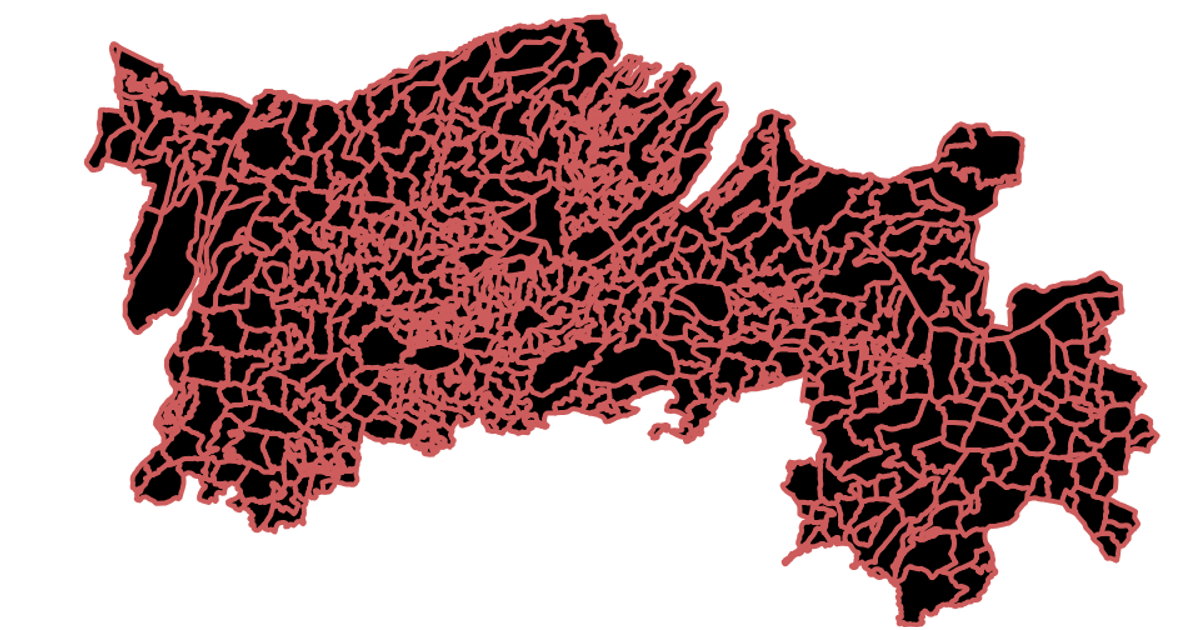
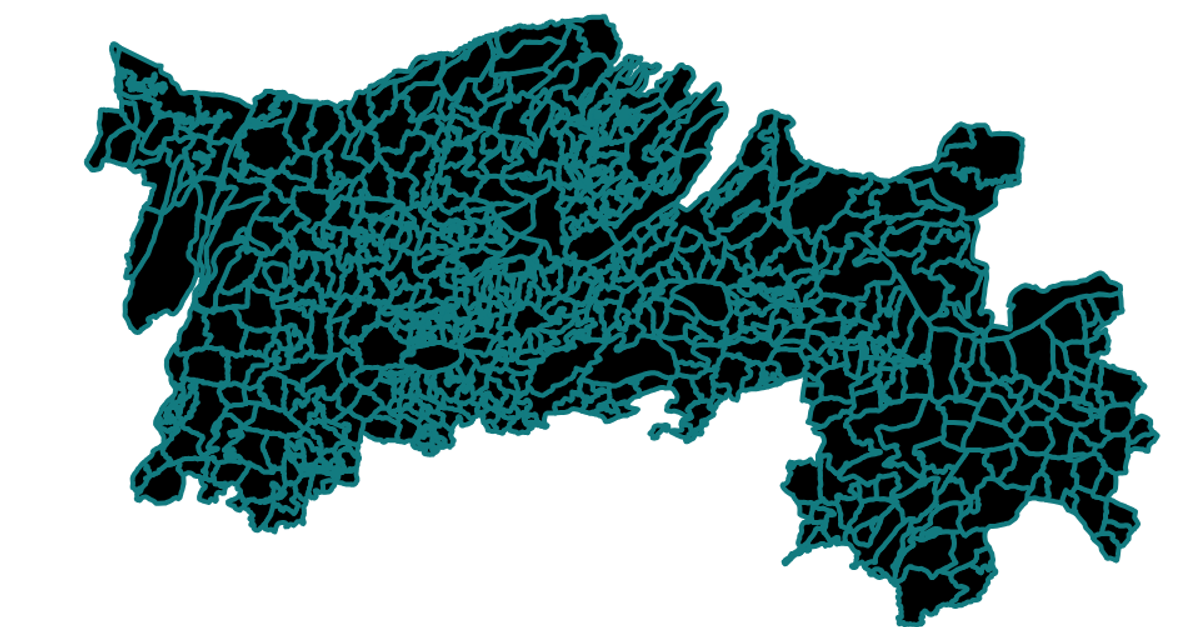
This visualization displays Salem city points on a geographical map, showing the spatial distribution of the cities dataset over a region. The map renders country boundaries and interior borders using geo paths, with the mercator projection scaled to center on the Salem area. Built with React and D3 v5, the code employs `geoMercator`, `geoPath`, and TopoJSON
AI-generated descriptionA scatter plot of Data Canvas Sense Your City Dataset.
MIT Licensed



Comments
Sign in to join the discussion.