🌍 Public
practice tree
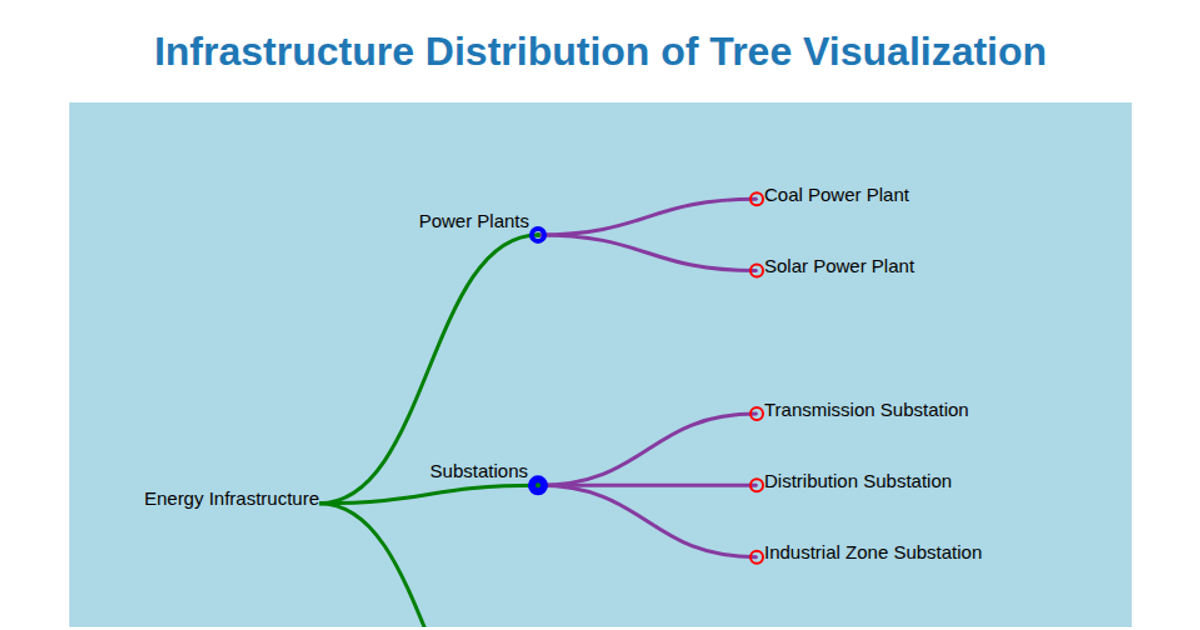
This visualization displays the hierarchical structure of energy infrastructure distribution, showing power plants, substations, and distribution centers as a branching tree. The code uses d3.tree() to compute node positions and renders curved links as SVG paths with color-coded strokes based on each node’s level. Circles represent nodes with radii scaled by each entry’s value, while leaf labels include capacity numbers. The example creates an SVG with a light blue background, using D3 v7 to append nodes and text with custom styling defined in the accompanying CSS.
AI-generated descriptionMIT Licensed



Comments
Sign in to join the discussion.