🌍 Public
iCE8-Tree-Prathima
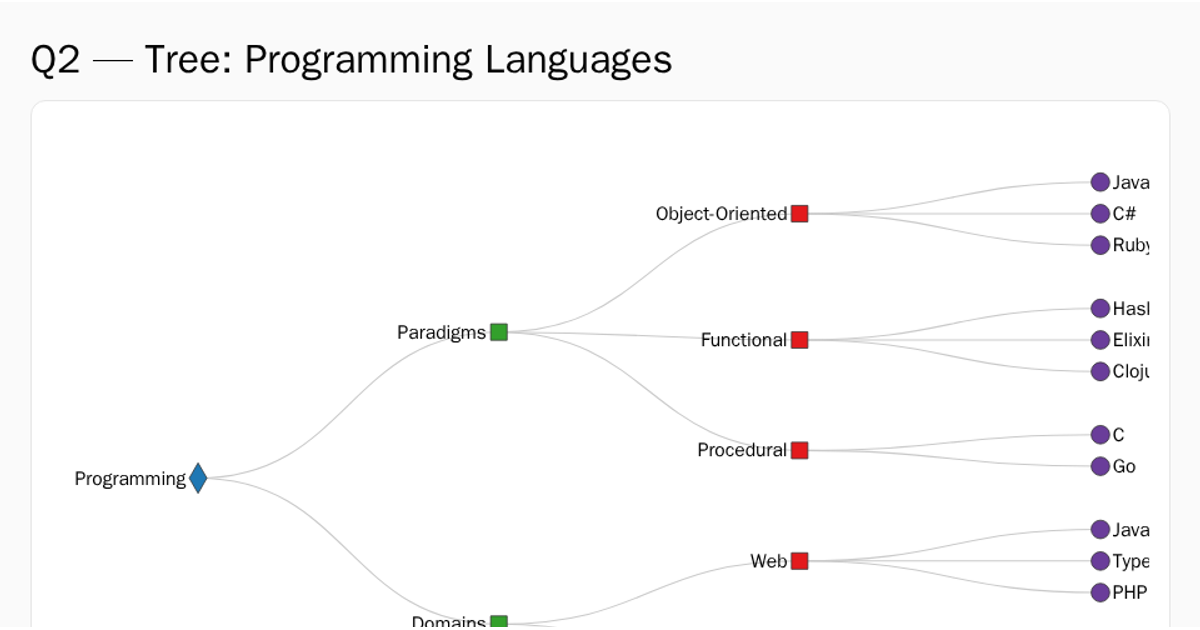
This visualization displays the distribution of energy infrastructure using a hierarchical tree layout. It depicts power plants, substations, and distribution centers as nodes, with circles scaled by assigned values and colored by type or level. The D3.js library’s `d3.tree()` and `d3.hierarchy()` methods structure the data, while SVG paths create curved links between parent and child nodes. Node attributes are set via `.attr` and `.style`, and the code includes conditional logic to render internal nodes differently from leaf nodes.
AI-generated descriptionMIT Licensed




Comments
Sign in to join the discussion.