🌍 Public
Menus
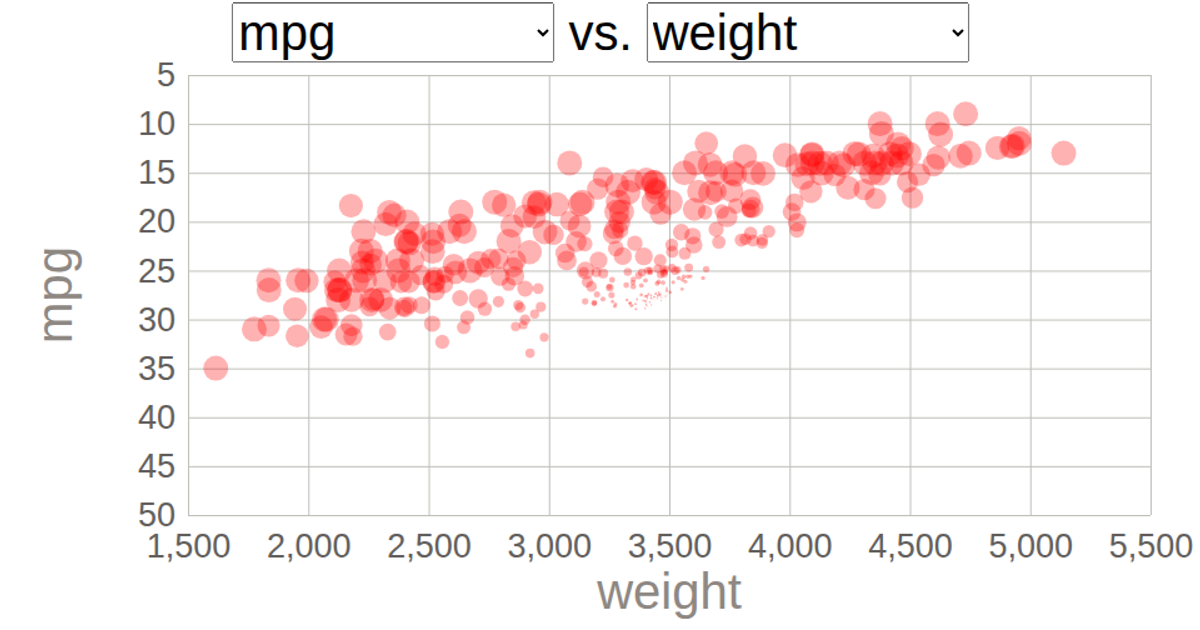
Two dropdown menus let a user select which columns of a CSV file to plot on a scatterplot’s x and y axes. The visualization is built with React, using d3’s `csv` loader and the `dropdownMenu` function to create the select elements. The SVG chart updates when either menu’s value changes, displaying transaction data from Taiwan’s real-estate records.
AI-generated descriptionA bare minimum HTML page.
See also React Starter.
MIT Licensed



Comments
Sign in to join the discussion.